A2 Waterscapes of India
A2.1 Introduction
-
Capacities taught in this chapter
Scientific processWhy does land harbour more diversity than water?
How do scientific theories change over time?Scientific toolsHow do we investigate the distribution of aquatic communities in different regions of a river?Reading and interpretingCrossing the salt barrier.Bridging science, society and the environmentHas human activity altered fish distribution?
Let us do a simple activity. List ten animals and ten plants that live in water. Most people find it difficult to do this activity. Why is this the case? The simple answer is that we have a ‘blindness’ towards things that we do not regularly see or use. Organisms living in water are a perfect example of that.
- zooplankton
- Tiny invertebrate animals that drift in the water.
- phytoplankton
- Autotrophic (photosynthesising) microrganisms that are generally found drifting in the surface layer of water bodies.
Humans, being visual animals, observe things that are large, moving or colourful. Tiny aquatic zooplankton or phytoplankton do not come to mind at all. We know far less about aquatic life than terrestrial life, and our textbooks seldom do justice to the diversity of aquatic life.
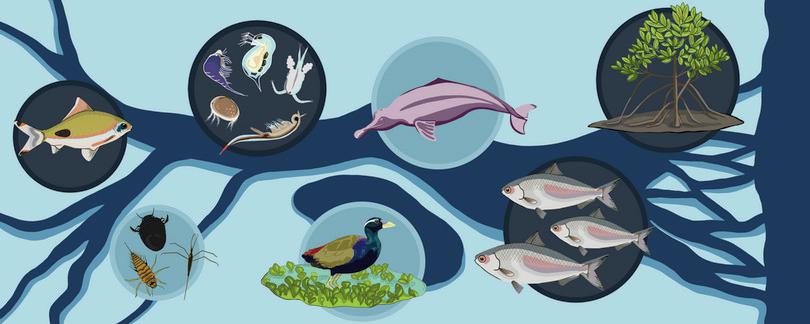
Figure A2.1 depicts some of the astonishing faunal and floral diversity found in the freshwater and marine waters of India.
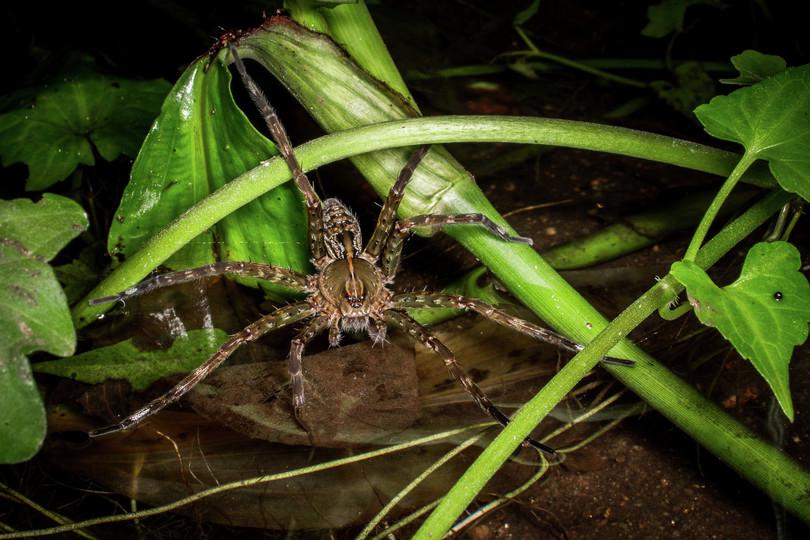
Figure A2.1 Can you identify these freshwater and marine organisms?
a, b, f, g. Copyright Samuel John.
c. NOAA’s National Ocean Service, Wikimedia Commons, CC BY 2.0.
d. Christian Fischer, Wikimedia Commons, CC BY-SA 3.0.
e. Kora27, Wikimedia Commons, CC BY-SA 4.0.
h. Copyright Neeharika Verma.
i. Vishal Bhave, Flickr, CC-BY-NC-SA 2.0.
j. Dinesh Valke, Flickr, CC-BY-SA 2.0
a. Fishing spider, Gudalur, Tamil Nadu
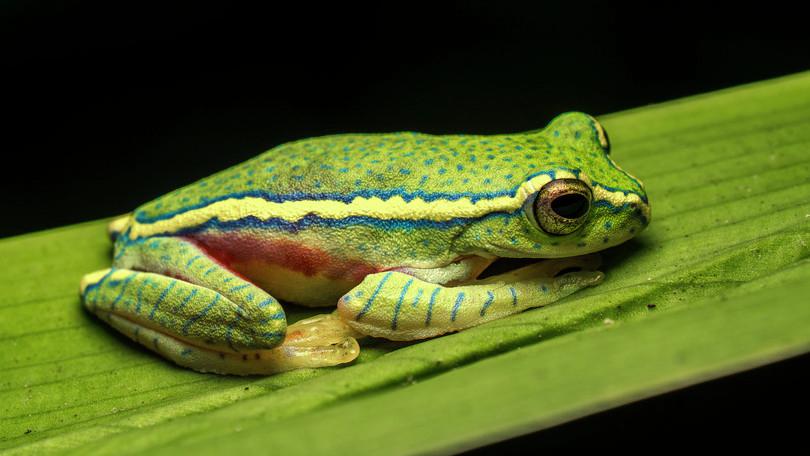
b. Tree frog, Gudalur, Tamil Nadu
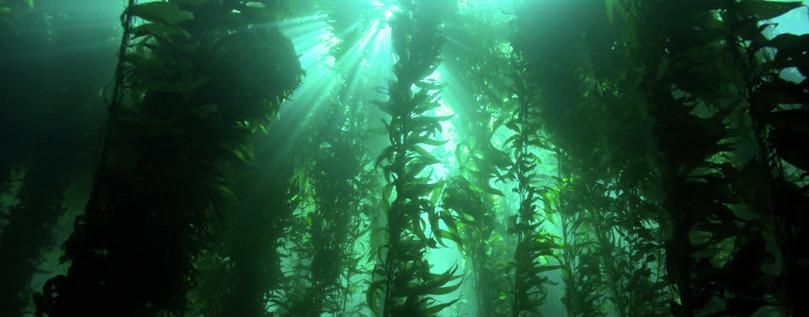
c. Underwater kelp forest
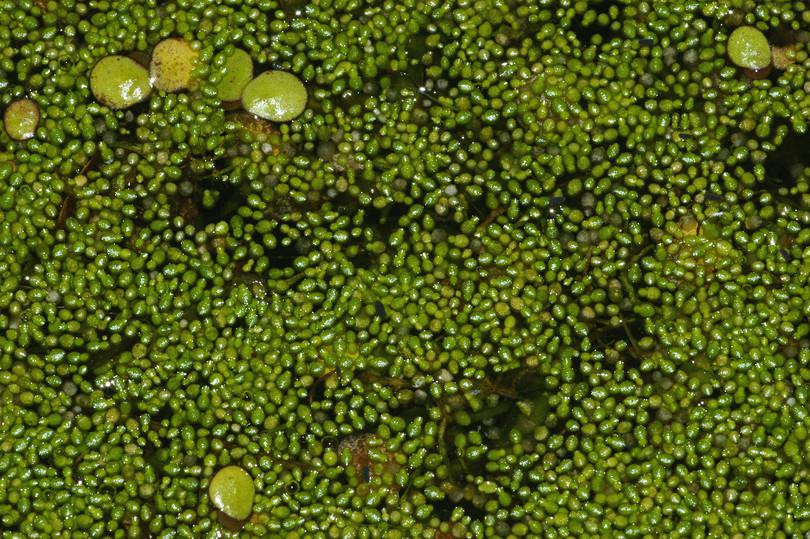
d. Wolffia (duckweed or watermeal)
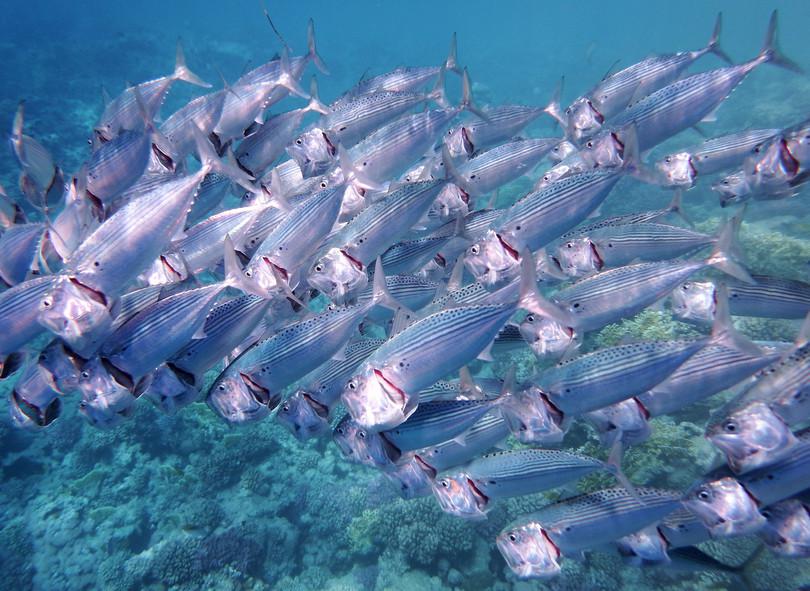
e. Indian mackerel
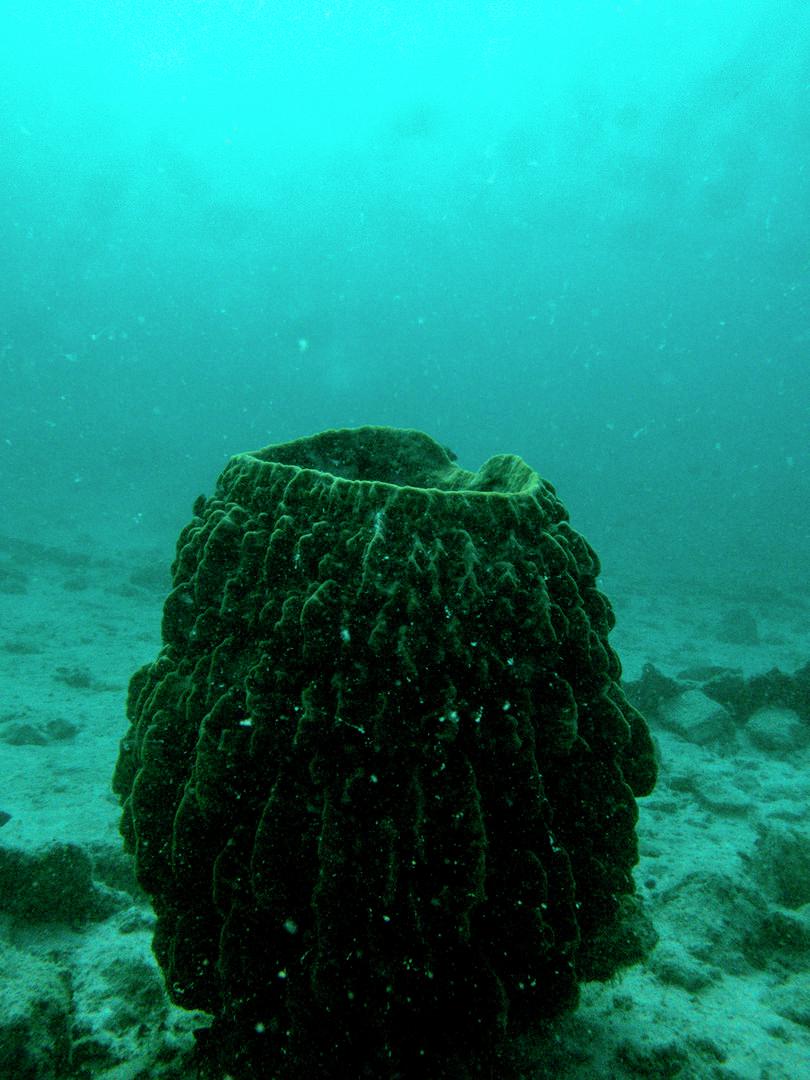
f. Porifera, Havelock, Andaman
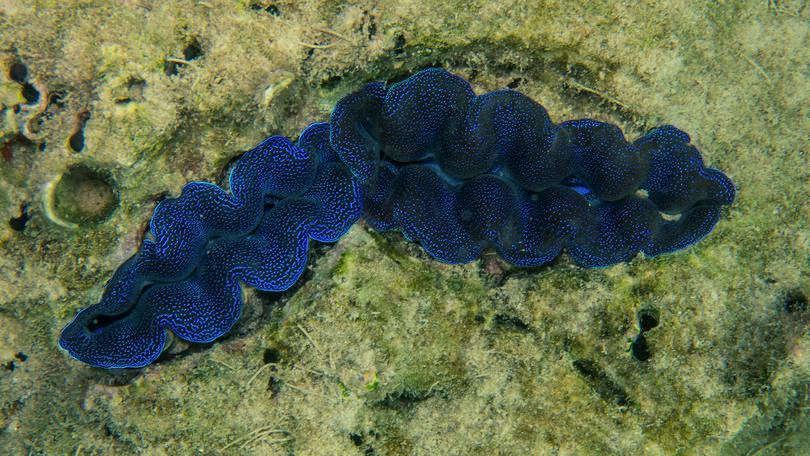
g. Giant clam, Havelock, Andaman
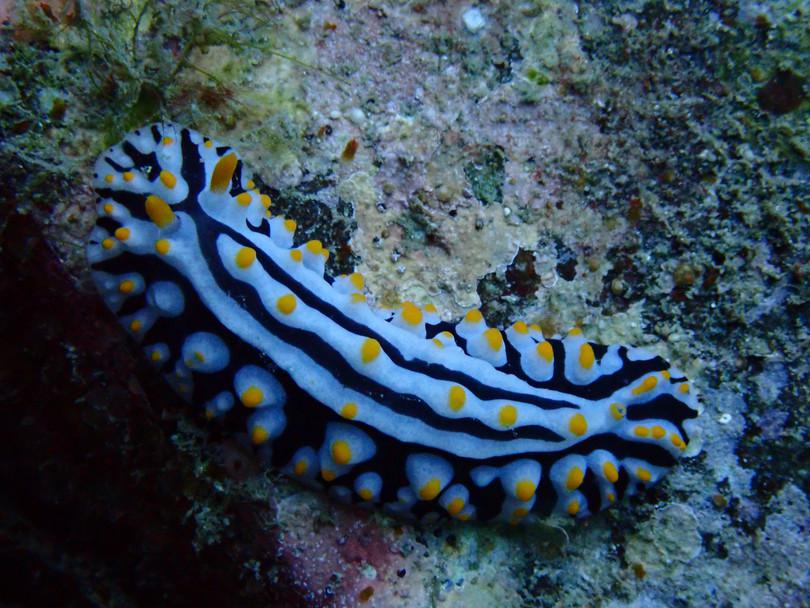
h. Sea slug, Netrani island, Karnataka
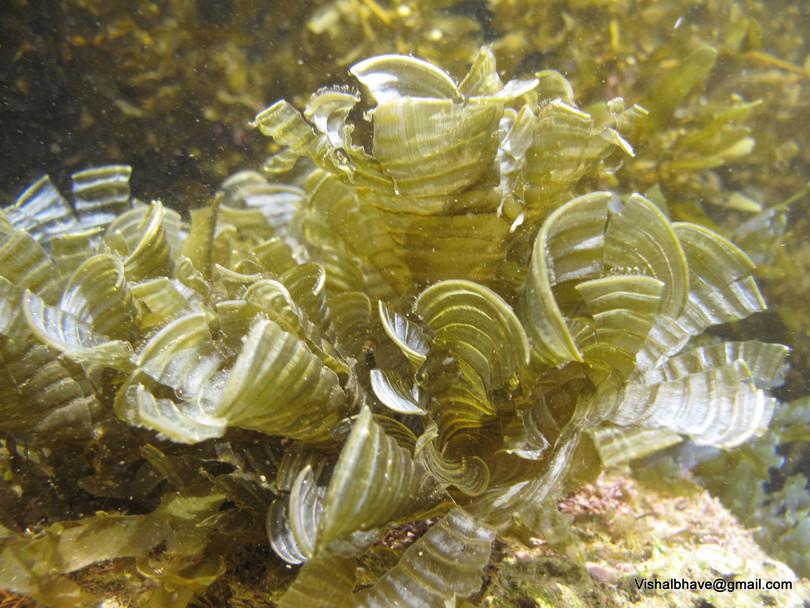
i. Peacock’s tail, Ratnagiri, Maharashtra
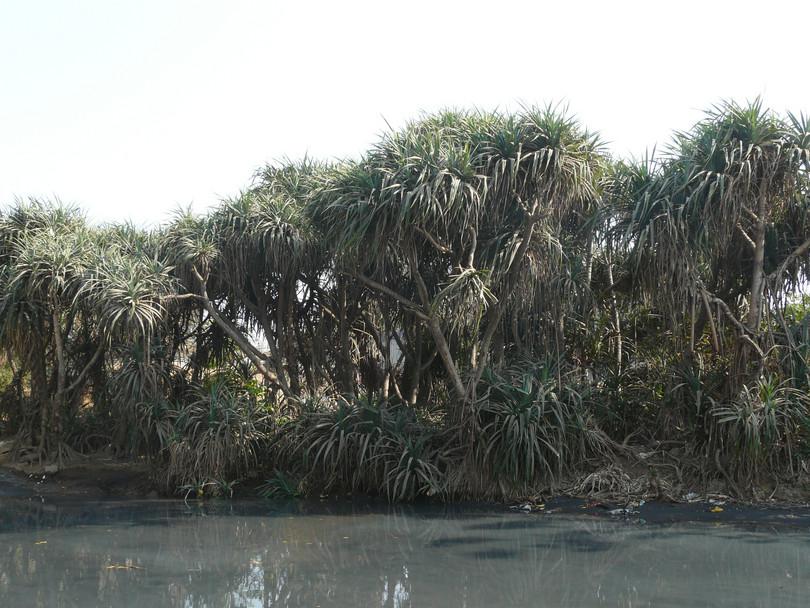
j. Screw pine (Ketaki), Thane, Maharashtra
This chapter focuses on freshwater ecosystems and the organisms that inhabit them. Fresh water is barely 2.5% of the total water on Earth (Figure A2.2a), but it harbours far more biodiversity than the marine system. That is why we chose fresh water rather than marine ecosystems for this chapter. Moreover, human civilisations have flourished around rivers and lakes, so it is important to know how these freshwater ecosystems have impacted our culture, and how humans are in turn changing these water bodies.
The chapter begins with a broad overview of why aquatic systems contain far fewer species than terrestrial ecosystems. The remainder of the chapter will use the example of the river Ganga to address various key capacities. The Gangetic basin and its tributaries are one of the most fertile and densely populated regions of the world and are central to India’s agricultural, cultural and ecological life. We use the river Ganga as a specific case study of how freshwater biodiversity changes over space and time.
Scientific tools such as observation, sampling and documentation will be discussed in the context of the river Ganga. We will study a specific fish, hilsa, that completes its life cycle both in fresh and marine waters. This develops the capacity of reading and interpreting (specifically searching, filtering and citing) relevant information. We learn from this chapter, and other chapters, that human lives are intricately woven around the natural world, and changes in one will lead to changes in the other.
A2.2 Why does land harbour more diversity than water?
Scientific process
Our Earth is known as the ‘blue planet’ because about 71% of its surface is covered by water. Only 29% is constituted of land. About 97% of water on Earth is salt water (comprising the oceans), and around 3% is fresh water (Figure A2.2a).
- macroscopic
- Objects that are large enough to be viewed with the naked eye.
The ocean, despite its large area and volume, supports only 15% of the total diversity of macroscopic life on Earth; whereas fresh water supports 5%, and land supports the remaining 80% of species diversity (Figure A2.2b).1 Oceans seem to be ideal habitats for life: they contain a lot of water, are well connected, do not experience extreme temperatures as seen on land, and after all, life has existed in the ocean for much longer periods than on land.

Figure A2.2a Proportions of fresh and sea water and location of fresh water on Earth.
Adapted from USGS, Wikimedia commons, public domain.

Figure A2.2b Proportions of macroscopic marine, freshwater and terrestrial species.
Exercise A2.1 Interpreting graphs
Quantitative skillsFigure A2.2a is a stacked bar chart, and A2.2b is a pie chart. Both are used to visualise data that shows proportions of a whole. In Figure A2.2, the figures are percentages. Stacked bars are better for displaying proportions as you can compare multiple categories.
- Of the total water, only about 3% is fresh water. What proportion of the fresh water consists of ground water?
- The total amount of water on Earth is around 1.356 million cubic kilometres. And water in rivers is around 2120 cubic kilometres.2 What percentage of total water makes up rivers?
- Draw the third bar chart as a pie chart. Which representation (bar chart or pie chart) best illustrates the data? Give a reason for your answer.
Why are there so many more species on land than in the ocean? Is it a problem of documentation: since it is more difficult to work in the oceans, are there simply fewer studies carried out on marine organisms? Or are there any other reasons?
Scientists have suggested three main reasons for this skewed biodiversity on land:3 4
- Oceans are less productive per unit area than land.
- They show less habitat complexity than land.
- Water exerts considerable drag on organisms, making it difficult to move in water.
Let us learn more about these three points.
Productivity
The productivity of an ecosystem is the amount of solar energy that is converted into organic products by the primary producers, which are generally the photosynthetic organisms. Primary production is largely controlled by light and nutrients in aquatic ecosystems. Productivity in oceans is slightly less (~48.5 gigaton carbon/year net primary production (NPP)) than that on land (~56.4 gigaton carbon/year NPP), even though oceans have twice the surface area compared to land.5 6 Net primary productivity is how much organic carbon is produced by the autotrophs (photosynthesising microorganisms like phytoplankton), minus the carbon dioxide that is produced by respiration per unit area.
Although sunlight may reach as deep as 1000 metres into the ocean, photosynthesis is not possible beyond 200 metres, limiting primary production. Scientists measure productivity by indirectly measuring the amount of chlorophyll. This is done by recording the amount of light reflected by the surface of the water in a particular wavelength band.
Productivity in marine environments is restricted to:
- chemotropic microbes
- Microbes that use inorganic chemicals in their environment as a sources of energy.
- hydrothermal vents (areas in the sea floor where geothermally heated water is discharged) where chemotropic microbes use heat energy for their metabolism
- coral reefs (underwater ecosystems characterised by corals)
- shallow coastal zones, at the interphase of land and water.
Extra Reading Calculating productivity of oceans
How does one calculate the productivity of oceans? Scientists use satellites to gather data on the net primary productivity of a large area. In the oceans, phytoplankton use chlorophyll and other related pigments to carry out photosynthesis. By measuring particular wavelengths of light reflected from the surface of water, satellites can measure the concentration of chlorophyll. These are then converted via a series of algorithms to chlorophyll concentration. These chlorophyll maps help scientists to know the health of the ocean.
In the example given, dark green shows high amounts of chlorophyll indicating that these are areas where phytoplankton are growing. This is typically near the cold polar waters, the equator, and along the shores of the continents. Blue areas indicate low amounts of phytoplankton growth. Land and some areas where the satellite could not collect data are shown as light and dark grey.
From these images, one may infer that the highest concentrations of chlorophyll (and therefore high concentration of phytoplankton) seem to be near colder regions, or where ocean currents bring cold water to the surface. Cold water by itself doesn’t stimulate phytoplankton growth. But when cooler, deep water from the ocean floor is brought up, it carries nutrients along with it and this facilitates phytoplankton growth.
Habitat complexity
- niche
- The abiotic and biotic conditions necessary for an organism to persist, and the organism’s role within the ecosystem.
To understand why oceans are less biodiverse than terrestrial habitats, we have to look at differences in habitat over land and ocean. Apart from the shallow sea floor, oceans show less habitat complexity than terrestrial environments. A multidimensional, complex habitat creates new niches for species to explore. A niche is the relationship of a species with all its biotic factors (predators, competitors, parasites, and so on) and abiotic factors (including temperature, humidity, sunlight). Another way to think about a niche is the space of resources that is available to and used by species.
- topography
- The layout or nature of a region that highlights its physical features.
A complex habitat allows species to occupy a variety of niches. It is therefore conducive to high diversity. For example, plants provide structurally complex habitat both above ground (with their leaves, stem, branches, flowers and fruits), and below ground (with roots). Each of these spaces can be utilised and occupied by various species. The shallow sea floor can be topographically complex with coral reefs, seaweed, and so on, but much of the open sea is rather homogeneous, harbouring few species.
Characteristics of water
Water is denser and more viscous than air. Density depends on the temperature and salinity of water.7 Water exerts considerable drag on organisms that move within it. Because of this, smaller animals like insects move faster on land and in the air than in water, and as a result, animal-mediated pollination, dispersal of seeds, spores, and the like, is much faster on land and in the air than in water.
Table A2.1 shows that plants and their pollinators (particularly insects) are several orders of magnitude more diverse on land than in water. Mating scents and visual information don’t travel well in water (water may be murky, or signals may not travel long distances), thus limiting the potential for choosing mates.
Summary
Close to three-quarters of Earth’s surface is covered by water, yet water harbours only about 20% of the macroscopic diversity found on Earth. We learned that oceans have less diversity because they have lower primary productivity per unit area, lower habitat complexity than land, and physical parameters of water such as density and viscosity that hinder the movement of smaller animals. Fresh water comprises only about 2.5% of the Earth’s surface, but harbours far greater diversity than marine waters.
A2.3 Why do organisms live where they do?
Reading and interpreting
Although there is far less biodiversity in water than on land, some groups are largely aquatic and some are largely terrestrial. Table A2.1 shows the numbers of species of selected taxa that live in marine, freshwater or terrestrial habitats.
| Taxon | Marine | Fresh water | Terrestrial |
|---|---|---|---|
| Molluscs (gastropods, bivalves, copepods) | 61 800 | >6 400 | 25–30 000 |
| Arthropods (insects, arachnids) | 3 400 | >105 000 | >107 |
| Arthropods (crustaceans) | >65 000 | 12 000 | 4–5 000 |
| Chordates (fishes) | 15 000 | 15 000 | 0 |
| Chordates (mammals, tunicates and other vertebrates) | 3 625 | >7 100 | 25 000 |
| Fungi | <1 000 | <1 000 | >>106 |
| Photosynthetic organisms (plants and algae) | 10 100 | >2 600 | 280 000 |
Table A2.1 Species richness among a few selected taxa in marine, freshwater and terrestrial ecosystems.
Adapted from Grosberg, RK, Vermeij, GJ and Wainwright, PC, ‘Biodiversity in Water and on Land’, Current Biology 22, no. 21 (2012): R900–903, doi: 10.1016/j.cub.2012.09.050.
Reasons for species distribution in the environment
From Table A2.1 you will notice that some taxa are predominantly aquatic or terrestrial. Why are some species present only in freshwater habitat, some only in marine habitat, and a handful that traverse both? Why are different species found at the source and the mouth of the same river?
- evolutionary constraints
- Restrictions, limitations, or biases impacting adaptive evolution.
Answers to such questions are not simple. Distribution of species is a consequence of biotic and abiotic interactions together with evolutionary constraints. That is, a newly formed species simply may not be present in a habitat because it hasn’t had sufficient (evolutionary) time to occupy that habitat.
- obligatory
- Compulsory.
You will know that dolphins are marine mammals. Did you know some dolphin species live in rivers? Consider the distribution of the endangered Gangetic river dolphin (Platanista gangetica), shown in Figure A2.3a. It is found mostly in the Ganga-Bramhaputra-Karnaphuli river systems in India and Bangladesh. They are obligatory freshwater animals. Why do you think the river dolphin is not found elsewhere? Are there specific requirements for it to inhabit certain areas and not others?
- echolocation
- A sensory technique in which animals emit sounds and detect their reflection from objects in their environment, allowing them to detect their physical environment.
- anthropogenic
- Caused by or originating from human activity.
Gangetic river dolphins are found in shallow to moderate depth freshwater habitats with high turbidity. These dolphins are effectively blind, and they use echolocation (similar to bats) to capture prey such as small fish and invertebrates. Researchers have found that the ultrasonic clicks of this species are an adaptation to navigating through shallow, acoustically complex habitat that have clutter and reverberation.8 What is interesting is that the river dolphin employs different foraging strategies to catch prey at different depths of the river. At the surface and middle regions, it uses passive hearing and echolocation, whereas at the bottom it uses electroreception.9 The behaviour and physiology of the animal, as well as anthropogenic factors such as dams or river pollution, limit its distribution.
The flowchart that follows (Figure A2.3b) highlights some factors influencing the distribution of this species. We have highlighted various reasons why this dolphin is distributed in only certain areas. There could be several reasons why a species is present or absent in a particular area. Connect what you have learned here to information about the distribution of plants and animals in the Western Ghats.
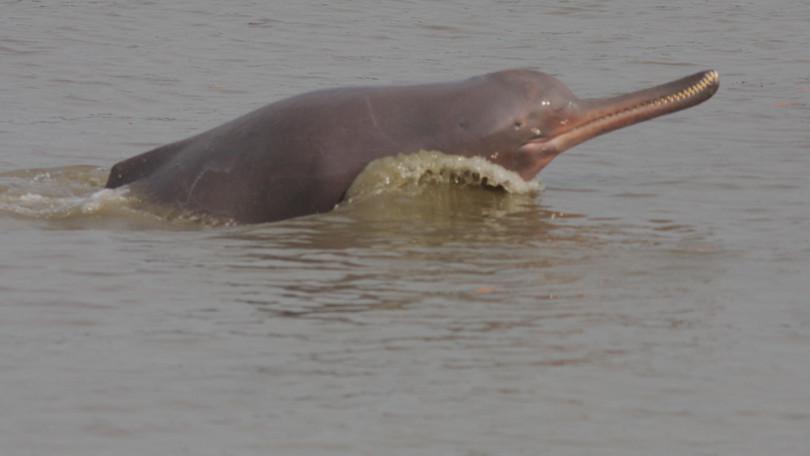

Figure A2.3 a.Gangetic river dolphin. b. Flowchart illustrating why the Gangetic river dolphin lives where it does.
a. Zahangir Alom, Wikimedia commons, public domain.
b. Adapted from Reece, JB, et al., Campbell Biology, 10th ed. (Boston: Pearson Education, 2014).

Summary
In this section we learned that some groups are predominantly aquatic, while others are predominantly terrestrial. Using reading and interpreting as a capacity, we learned that the distribution of Gangetic river dolphin is influenced by various abiotic and biotic parameters, as well as their evolutionary history. Unfortunately, human activities impact the distribution and abundance of organisms too.
A2.4 The water cycle and fresh water bodies
Reading and interpreting
India accounts for 2.45% of the global landmass and 4% of the world’s freshwater resources. What exactly is a freshwater body? Fresh water is characterised as having low concentration of salt: usually <0.1% compared with water in the ocean that has around 3% salinity. The amount of fresh water is always changing because of the water cycle. Water molecules continuously evaporate, precipitate and condense, and water is always changing states between liquid, solid and gas.

Figure A2.4 The natural water cycle.
Susnata Paul and Silja Samuel Bansriyar
The water cycle we study in school seems simple, but it is rather complex as you can see in Figure A2.4. Figure A2.4 shows the water cycle without human impact. The water cycle is intimately linked with energy exchange in the atmosphere, on land and in the oceans, and is responsible for Earth’s climate. Climate change in turn affects the water cycle. To read more about the water cycle and climate, refer to this comprehensive review.
Freshwater habitats
Lakes, ponds, streams, rivers, wetlands, estuaries, and water in caves are all considered freshwater bodies. Figure A2.5 shows some of the diversity of freshwater bodies found in India. Groundwater, and water as snow and ice, also constitute freshwater. Lakes, ponds, streams and rivers are freshwater bodies that you might be familiar with. Ponds and lakes are standing (lentic) water bodies spanning anywhere from a few square metres to several square kilometres, formed because of various geological processes.
Streams and rivers, on the other hand, have moving waters (lotic), differing in speed and volume of water flow. Headwater streams where rivers originate are often turbulent, cold, and clear; further downstream, where many tributaries join, the river is warm, deep and turbid.
A wetland is a habitat that is characterised by wet or flooded soil, dominated by an anaerobic environment and plants that are adapted to growing in such conditions. Wetlands are often neglected as ‘wastelands’ because they appear to be dark, smelly, mosquito-infested areas. However, wetlands are areas of high biodiversity that act as buffer zones during floods, and provide habitat for migratory birds and livelihood opportunities for humans. The well-known Bar-headed geese that migrate over the Himalaya (~24 000 feet) spend their winter time in various wetlands across India. As of 2020, there are 37 wetlands in India.
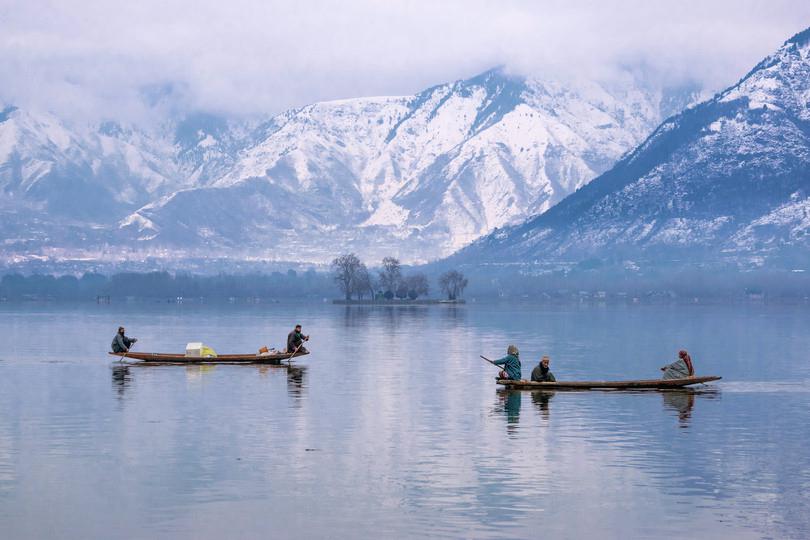
Figure A2.5 Examples of freshwater bodies in India.
a. Suhail Skindar Sofi, Wikimedia commons, CC-BY-SA 4.0.
b. Ashish Sharma, Wikimedia commons, CC-BY-SA 4.0.
c. Unknown author, Wikimedia commons, CC-BY-SA 4.0.
d. Leon Petrosyan, Wikimedia commons, CC-BY-SA 3.0.
Dal lake, Srinagar
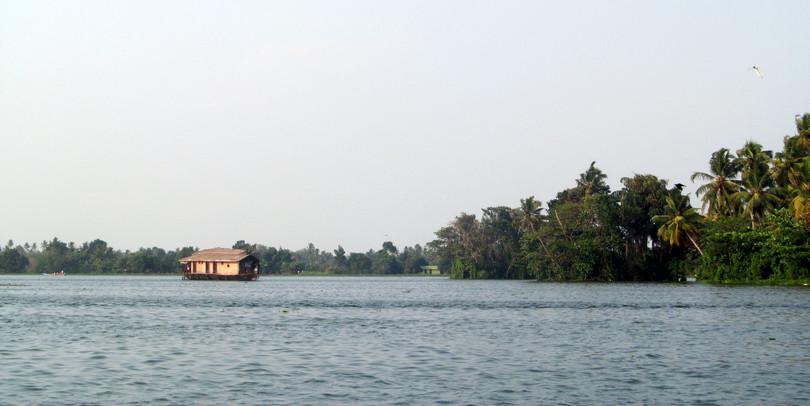
Vembanad kol wetland, Kerala
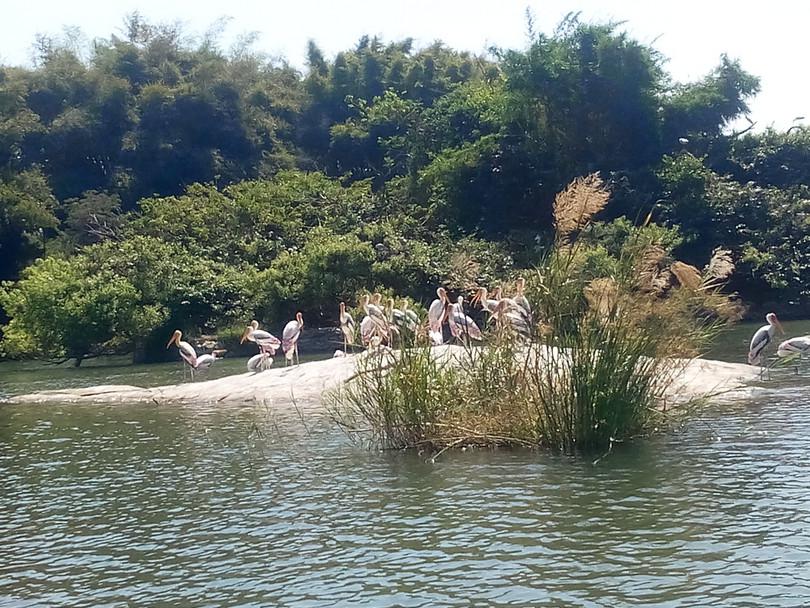
Kaveri River, Karnataka
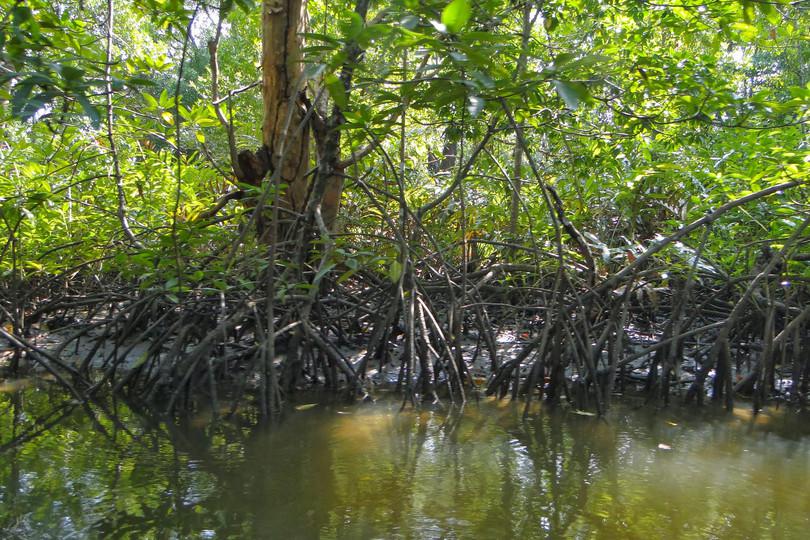
Mangrove forest, Sundarbans estuary
Estuaries are transitional areas between the sea and a river, with salinity varying between sea and river. As a river or stream opens into the sea to form the estuary, the salinity fluctuates seasonally and tidally. For example, at high tide, sea water enters the estuary and salinity rises. When the river floods, freshwater enters the estuary and the salinity declines. Like wetlands, estuaries are also areas of high biodiversity, and provide livelihood opportunities for many species.
Mangrove forests are found near coastlines and estuaries in tropical and subtropical regions and form a unique habitat. The mangrove forests of the Sundarbans islands are the largest in the world, covering around 40 000 km2 between India and Bangladesh. These mangroves harbour unique flora and fauna including tigers, saltwater crocodiles, water monitor lizards, Gangetic River dolphins, Irrawaddy dolphins and Olive Ridley turtles.
While the mangrove ecosystems in the Sundarbans receive worldwide attention, lesser-known mangrove forests in India are the Shravan Kavadia and Guneri mangroves in Kutch Gujarat, which are inland mangroves (disconnected from the sea). Lakshwadeep’s Minicoy and Kalpeni islands also have mangrove forests.
Summary
India accounts for 4% of the world’s freshwater resources. The natural water cycle – the movement of water from atmosphere to oceans, rivers, groundwater and back – is responsible for Earth’s climate. Although we are familiar with rivers and lakes, we often know less about the wetlands and estuaries present in India. These are areas of high biodiversity and are also buffer zones during floods.
A2.5 Changes in aquatic communities in a river
Scientific process Scientific tools
A river is a flowing, dynamic water body. Physical and chemical parameters and organisms that inhabit the river are constantly changing across the river. This section will focus on the changes in biological communities in a river.
In the 1980s, freshwater ecologist Robin Vannote proposed a concept to explain the structure and functioning of streams and rivers. By observing Canadian rivers, he proposed that physical and chemical parameters, composition and functional diversity of aquatic communities change along the length of the river from its headwaters to the mouth of the river. This is known as the River Continuum Concept (RCC) (Figure A2.6).10 RCC is particularly useful for studying the invertebrate communities that live in the benthic zone, which is the bottom of the water body.
What do we mean by a river changing continuously? Consider some of the physical and chemical changes that happen to a river:
- At the source or the headwaters, the river, called a stream, is narrow and often lined with dense vegetation. Organic matter is contributed by the leaves that fall into the river. These leaves form coarse particulate matter. In Figure A2.6, the y axis is the stream order, which indicates the level of branching of a river system. In the Horton and Strahler method the lowest order, number 1 is assigned to the headwaters or the highest elevation point of the river. The same system is used in map data interpreted in Geographic Information Systems.
- As the river reaches the wider middle regions, the amount of algae, detritus and microbial communities attached to submerged rocks increases, and this contributes to the organic matter in the river.
- At the lower reaches of the river (mouth of the river), water is deep, turbid, and has large amounts of fine particulate matter. The pH and dissolved oxygen, among other parameters, may also change along the length of the river.
- trophic level
- The position an organism occupies in a food chain.
Now let us look at the changing aquatic communities. Before you read further, name some creatures living in rivers. Did you think of fishes, frogs, turtles and some mammals? Macroinvertebrates such as insects, snails, worms and crustaceans are also important members of any freshwater community. These groups help in breaking down leaves and organic matter, recycling nutrients back to the environment, and providing energy and regulating energy flow to the upper trophic levels.

Figure A2.6 How a river changes as it moves from the headwaters to the mouth. Phytoplankton and zooplankton communities also change along the river.
To study whether macroinvertebrates change along the length of the river, scientists classify them based on how they acquire food.11 12
- Shredders cut and chew large pieces of living or dead plant material, and in the process shred plant material into tinier particles.
- Collectors consume fine particulates (typically < 1 mm in size). Collectors can either filter or gather fine particulate matter.
- Grazers scrape food from algae and other substrates.
- Predators feed on other animals.
Shredders, collectors, grazers and predators have different morphological structures and behavioural mechanisms to obtain food. For example, sharp and pointed teeth may be characteristic of shredders and predators. Collectors may crawl around on the bottom of the stream collecting food particles.
- taxonomic affiliations
- Being associated with a specific taxonomic classification. See also: taxonomy.
It is important to remember here that organisms are classified into functional feeding groups regardless of their taxonomic affiliation. For example, dragonfly larvae and lace-wing larvae are both functionally predators, but taxonomically, dragonflies belong to the order Odonata and lace-wings to the order Neuroptera. The rice chapter shows how different varieties of rice are classified according to morphology or DNA. In the current chapter, the classification of organisms is based on their ecological niches.
Exercise A2.2 Assigning ecological niches to sections of the river
Scientific processBased on the information about macroinvertebrate feeding groups, predict which groups should dominate the headwaters and which groups should dominate the mouth of a river.
Limitations to the river continuum concept and newer ideas
The RCC was tested in several temperate rivers. But over the years, researchers found certain limitations to this concept. It turns out the concept holds true in temperate, near-pristine, forested, perennial streams, but has to be refined for tropical rivers and streams.13 14 15 RCC focuses on the main stem of the river, without paying much attention to the smaller tributaries. Additionally, RCC assumes that the composition of an aquatic community depends only on environmental heterogeneity. But the way organisms disperse also affects community composition.
Considering the spatial and temporal complexity of the riverine system, scientists have shifted their thinking about rivers from seeing them as longitudinal gradients to seeing them as networks or dendritic systems.16
Simply put, a river has natural discontinuities. For example, lakes and tributaries have their own abiotic parameters that may be very different from the main stem of the river. The altitude of waterbodies (mountainous or lowland) also changes the abiotic and biotic parameters. Spatial and temporal discontinuity is also caused by the flow regime: the magnitude, frequency, duration, predictability and rate of change of flow hugely influence the biodiversity of riverine ecosystems.
- river reaches
- A part of a river or stream that extends inland in a straight manner, which has constant hydrological conditions.
Taking all these factors into account, scientists now think of rivers as networks or dendrites. River reaches, sections of rivers that have similar hydrologic conditions, can be thought of as branches, and discontinuity represents the nodes of a network. These and several new models have been tested by a number of ecologists, and are still being modified.16 This is an example of how science advances over time.
The body of scientific knowledge is not static. Our current understanding of a concept may change as new evidence is gathered or new tools and technologies come about. Several new concepts and theories have blossomed from the river continuum concept, advancing our scientific knowledge.
Studying changes in biotic and abiotic factors in a stretch of river
Professor Prakash Nautiyal of the H.N.B. Garhwal Central University studied how abiotic and biotic factors change in the Himalayan stretch where the Ganga originates. He collected aquatic organisms from several places around the headwaters and the foothills of the Ganga.17 We will tell you the results of his investigations shortly.
How did Nautiyal decide where to collect and how much to collect in a vast flowing river? One cannot collect all the individuals in an area to find out the types of organisms present in that area. That would be impractical, unnecessary and expensive. Instead, one collects a subset that represents a larger population.
- sampling
- An estimation method that involves the collection of data of a subset of individuals from a larger population.
Nautiyal collected a number of replicate samples to represent the larger community in the area. This is known as sampling.

The next section will tell you how to sample macro-benthic (organisms living in the bottom of the river or stream) invertebrate community in freshwater streams. The technique can be extended to sampling vertebrate and terrestrial taxa as well.
Sampling aquatic macro-benthic invertebrate communities in a stream
- dissolved oxygen
- The amount of oxygen dissolved in water.
- biological oxygen demand
- A measure of the amount of dissolved oxygen required by aquatic aerobic microorganisms to decompose organic material.
- Where should I sample? Plan ahead about the areas you want to sample. Look at google map images or topographical maps published by Survey of India of the area you want to sample. This will give you a good idea of the natural and human-made features of the land. It is also worthwhile to talk to local people who know the river or stream. Keep in mind that you want to select areas that truly represent the larger area. You do not want to select areas that are conveniently close together.
- How many samples will give an accurate representation of the biodiversity in the area? You can decide depending on the family/taxa accumulation curve over the sampling effort (that is, you sample the area until you no longer find new species). Read more about this in the fungus chapter.
- When should I sample? Monthly sampling over a year is ideal, but pre- and post-monsoon and winter sampling will give a good idea of community composition.
- What water quality parameters should I measure? Temperature, pH, dissolved oxygen, total suspended and dissolved solids, biological oxygen demand, rate of water flow, and turbidity are some basic water parameters that scientists measure.
- What equipment do I need? Laboratory equipment for measuring the physical parameters and custom-built, cheap equipment can be used to collect various organisms. Sieves of various sizes catch different phytoplankton and zooplankton. Some simple equipment is shown in Figure A2.7.
- Observe the organisms in their natural habitat, because once you preserve them, the behaviour of an organism in its natural habitat is lost. Observe whether an animal has any distinct morphological features that allow you to classify them as shredder, collector, grazer or a predator.
- Preserve specimens in ethanol in tight leak-proof jars or vials. Include a label detailing the place of collection, date, name of the person who collected the specimen, and so on, all written in pencil. Put the label inside the jar (ethanol erases ink marks). It is important to preserve a few individuals per species, but do not kill organisms unnecessarily. For example, it is unnecessary to preserve very common species unless you are planning to do some genetic analysis.

Figure A2.7 Equipment needed to sample aquatic organisms.
Adapted from Subramanian, KA and Sivaramakrishnan, KG, Aquatic Insects for Biomonitoring Freshwater Ecosystems: A Methodology Manual (Bangalore: Ashoka Trust for Research in Ecology and Environment, 2007).
- dichotomous key
- A guide, typically with paired contrasting morphological characteristics, that helps the user identify an organism to the family, genus or species level.
- Identify the specimens you have captured. Use a field guide18 or specialist identification manual (see Figure A2.8) to help you. You may need to consult an expert taxonomist to identify specimens to species level. Identification can be based on morphological or molecular characters. Some of these techniques are covered in the Rice chapter. Figure A2.8 is an example of a key for aquatic invertebrates.

Figure A2.8 Key for identifying macroinvertebrates in rivers.
Print your own insect key
We encourage you to explore your surroundings. Make use of this insect key on your treks!
- Keep a data sheet to record as many details as possible about where you have collected your sample, and all the parameters about it. This forms the raw data for your study, and forms the basis for any further analysis. It is good practice to write these things down in a book, and then, transfer it to an Excel spreadsheet. Figure A2.9 is an example of a typical data sheet.
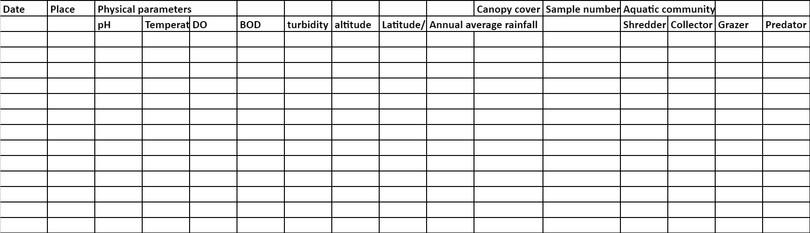
Figure A2.9 Example of a data sheet to record aquatic invertebrate community in an area.
Exercise A2.3 Analysing data about freshwater invertebrates
Reading and interpreting
- Some biology students went on a trip to visit a nearby water body. They found the following organisms in water. Using the aquatic insect key, identify which group each organism belongs to.
- It has six legs, swims on the surface of water, and the first pair of wings forms hard covers over the second flimsy pair of wings.
- It is large, has a bivalve shell, and is sometimes found attached to rocks.
- Morphological adaptations to living in running water would be related to body shape, locomotion, breathing, and acquiring food. Brainstorm and list some adaptations you expect invertebrates to have.
- You have learned about the classification of aquatic organisms based on the food they eat. Fill in the table below about adaptations and the trophic level association in a food web. The first row has been completed.
- If you have a river or stream close to your locality, head out to collect samples of the aquatic macro-benthic invertebrate communities in it. Divide your classroom or study circle into groups so that you can cover more area. Make use of the insect key and steps listed here to document your observations. Once the field visit is over, return and present your samples to the other groups. Did all the field groups have the same observations? If there were major differences in observations (such as presence or absence of a particular species), what factors could have caused them?
Functional feeding group Adaptation Position in the food web Shredder Chewing mouth parts adapted to hold the plant while chewing Herbivore or occasionally detritivore Grazer Collector/ filter-feeder Predator
Nautiyal collected samples from multiple sites along the length of the upper regions of Ganga (Figure A2.10a). He sampled from the Bagirathi and Alaknanda tributaries that are close to the origin of the river. Here, the river is cold and turbulent, with water flowing over rocky gorges, boulders and cobblestones.
His team collected samples from Rishikesh and Haridwar that are further downstream in the lower region of the river (Figure A2.10a). It flows through gentler mountain slopes, with pebbles and gravel. Nautiyal also looked at existing invertebrate and vertebrate data available for this region.
Based on earlier reports and current data, he found that aquatic groups differed along the regions sampled: while shredders were more abundant at the origin (the northern reaches of the river), grazers and predators were more abundant in the lower region of the river (Haridwar, Ajeetpur and Bhimtal, Figure A2.10b). Each of these functional groups contained different taxonomic groups.

Figure A2.10a Nautiyal’s sampling locations along the river Ganga and its tributaries.

Figure A2.10b Proportion of macro-benthic feeding groups across the headwaters and lower region of Ganga.
Exercise A2.4 Analysing and interpreting stacked graphs
Reading and interpretingQuantitative skillsFigure A2.10b is a stacked bar graph. Stacked bar graphs tell us how a larger category is broken down to smaller categories, and the relationship each category has to the total amount.
- Looking at Figure A2.10b graph, place the four macro-benthic feeding groups in the lower region of Ganga in the order of their abundance.
- What percentage of the total community do the collectors comprise in the origin of the river?
- Does this data follow the predictions of the river continuum concept?
Summary
A river continuously changes in its physical and chemical parameters and biotic communities as it flows from its origins to the mouth. Aquatic animals can be classified based on feeding groups, and different proportions exist along the length of the river. This can be found out by sampling these organisms. As a scientific process, we saw how the river continuum concept has now changed to thinking of rivers as networks that shape aquatic communities. As a scientific tool, we learned how to sample invertebrate taxa, collect data, and use dichotomous keys to identify these taxa.
A2.6 Has human activity altered fish distribution?
Bridging science, society and the environment
In the previous section we have studied how freshwater communities differ across the length of the Ganga. We will now look at how fish communities have changed over time, particularly due to anthropogenic factors. We will specifically examine hilsa (Figure A2.11), a fish that has great economic value, and a favourite of many Bengalis.
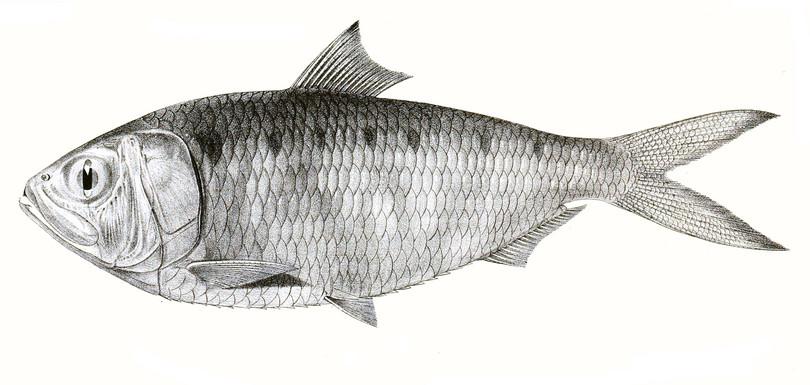
Figure A2.11 A Hilsa species found in the coasts and estuaries of the Indian Ocean
Achilles, Wikimedia commons, public domain.
Hilsa (Tenualosa ilisha), belonging to the family Clupeidae, is an anadromous fish, meaning it hatches in freshwater, but spends most of its adult life in salt water, and migrates back to freshwater to spawn (lay eggs). Salmon is another anadromous fish that you might be familiar with.
Bhapa sorshe iilish recipe
Fish is an important part of the cuisine found in coastal regions of the Indian subcontinent. One of the authors of the textbook has shared the recipe for one of their favourite dishes - bhapa sorshe iilish - have a look!
Hilsa, also called ilish, has a wide distribution from the Persian Gulf to the South China Sea, with Bangladesh contributing 75%, and India around 5% of the global catch.19 At present, hilsa is largely seen in the Bhagirathi-Hoogly river system, although once upon a time it occurred in adundance in the major rivers of India.
Declining hilsa populations
Over the years, hilsa populations have declined, almost entirely due to the construction of dams on the Ganga. Before dams were constructed, the monsoon significantly influenced the discharge of water in the Ganga, resulting in drought-like situations in the dry season and flooding in the wet season. The life histories of many fish, including hilsa, are adapted to these seasonal pulses. Dams ameliorate the pulses, averaging out the annual flow. This disrupts the breeding and migration of several fish, including hilsa.
- barrage
- A type of dam that enables the regulation of the water level in the river.
To prevent high silt deposition at the port of Kolkata, in 1971 the Government of India decided to flush water into the Hooghly River by constructing a barrage at Farakka. These 38 km long feeder canals helped to preserve and maintain the Kolkata port, reduced salinity, and improved the navigability of the Bhagirathi-Hooghly river system.
Although beneficial to human activity, dams and barrages also cause a fair amount of disruption. Construction of the Farakka barrage has been blamed for displacing people, flooding in Bihar, and decreasing freshwater discharge on the Bangladesh side of the Sundarbans, thereby destroying large areas of mangroves. The barrage has also increased droughts in parts of Bangladesh, causing agriculture to suffer.20 Watch the fisher community in the Farakka, Murshidabad region talking about their lived experience of the impact of this barrage. We will not focus on the socioeconomic impact of this barrage, but largely on the ecological one, although you should keep in mind that ecology influences the economy, and vice versa.
Scientists have documented the impact of Farakka barrage on the catch of hilsa over a number of years. The barrage has blocked migratory routes of hilsa, leading to an almost 100% decline in its freshwater population, and subsequent commercial collapse.20 21 A subset of the hilsa population completes its life cycle at sea and in estuaries, and the catches in estuarine waters in both Bangladesh and India have increased.19
Monitoring fish catch over decades
How does one calculate the increase or decrease of fish catch over decades? There are two different approaches: one is to conduct the study yourself. This can happen only if you are working in that field and have enough resources (people to help you do the work, and funding for your project) to conduct such a long-term study.
- meta-analysis
- A statistical method of analysing previously published studies that all revolve around a central theme.
The second method is to extract data from earlier reports and surveys and analyse the data. This is known as meta-analysis. The Indian government publishes a Handbook of Indian Fisheries that has data about how much fish is produced and sold across different states. Table A2.2 shows the hilsa catch in West Bengal from 2003 to 2012. As you can see, there is an overall reduction in the amount of hilsa caught over ten years. The hilsa caught in 2005 and 2006 is exactly the same, which could mean that no survey was done in 2006 and data from 2005 were used.
| Year | 2003 | 2004 | 2005 | 2006 | 2007 | 2008 | 2009 | 2010 | 2011 | 2012 |
|---|---|---|---|---|---|---|---|---|---|---|
| Hilsa (tonnes) | 26 985 | 27 256 | 19 061 | 19 061 | 16 072 | 11 744 | 10 560 | 54 930 | 16 523 | 8 510 |
Table A2.2 Marine hilsa caught from West Bengal from 2003 to 2012.
Data from Department of Animal Husbandry and Dairying, Handbook on Fisheries Statistics 2014, Section A: Production and Disposal (2014).
Exercise A2.5 Analysing data on hilsa catch
Reading and interpretingQuantitative skills
- What is the percentage reduction in hilsa catch from 2003 to 2012?
- Plot a graph of marine hilsa caught over time. What should be your x and y axis?
- The hilsa catch suddenly increased in the year 2010. Suggest an explanation for that unusually large catch.
These data are only for marine hilsa that are caught from large commercial vessels. Can you think of various factors that may influence the number and the kind of fish caught? For example:
- The season when the fish are caught (pre- or post-breeding time) will affect the nature of the catch. You may find a large number of adults or young fish, depending on the season when you decide to sample.
- The sites where the fishes are caught (downstream or upstream of the barrage) will affect the nature of the catch.
- The kind of net used to catch them and its deployment will affect the catch.
- The effort involved (number of fishers and boats) in catching also has an impact on the annual catch.
As you can see, only meticulous documentation of these and several other parameters will make the data collection rigorous. When you first start a study, you may not be aware of all these parameters. Additionally, there will be differences from one study to another, including some amount of subjectivity. A scientist should always acknowledge the limitations of their data collection in a research paper or technical report.
We hope this gives you a glimpse into factors that go into the careful planning and methodical documentation that go into a scientific study. Here we have talked about documenting the declining levels of the hilsa population in the Ganga. But we want to stress that careful documentation is extremely important in any scientific study.
Summary
In this section we focused on scientific tools like sampling, observation and documentation. By studying the tributaries of the Ganga, we learned that the composition of aquatic communities changes across the length of the river. This pattern of changing aquatic communities is seen in several freshwater rivers across the world. We investigate variation in the composition of aquatic communities by methodically collecting samples of organisms from various freshwater systems. Some careful thinking about where, when, what, how much to sample, and other factors, is important, as biased sampling can directly influence the results.
Observation is an important scientific tool we have explored in this section. Observation of plants and animals you are interested in often lays the ground for further research and on policies on conservation. Observation should go hand in hand with methodical documentation of what you observe. For example, documenting hilsa fish numbers over seasons across multiple years has led to an understanding of factors contributing to its decline. In this way, detailed observations and carefully planned sampling and documentation makes a scientific study rigorous.
A2.7 Crossing the salt barrier
Reading and interpreting Scientific tools
In the previous section, we learned about the migration of hilsa from marine to freshwater, and how its population is declining due to anthropogenic factors. In this section, we will understand what it means for any fish to go from marine waters to fresh water and back.
This is not at all a trivial problem. Most marine fish, if moved to fresh water, will die. The converse is also true. To understand how anadromous fish like hilsa or salmon manage to go from the sea to estuarine to freshwater bodies and back, we need to understand a bit about osmosis.
Osmosis (osmos is Greek for ‘push in’) is the movement of water or any solvent through a semipermeable membrane from a less concentrated solution to a more concentrated one. If you keep dry raisins in water, the raisins swell up, as water flows from outside to inside the cells (where there is a high concentration of solute) through the cell membranes.
- mole
- A scientific unit used to measure large quantities of very small particles such as atoms or molecules. A mole is 6.02 × 10²³ molecules.
Osmolarity is the measure of solute concentration, and is simply the number of moles of solute per litre of solution. Animals can maintain water balance in two ways: either by making their internal osmolarity the same as the external environment, or by regulating internal osmolarity independent of the external environment.
Sea water is more concentrated than body fluids for most marine vertebrates. They continuously lose water from their cells by osmosis. To avoid dehydration, marine vertebrates drink large amounts of seawater, and excrete the excess salt through the kidney and gills. Their urine is highly concentrated to save water (Figure A2.12).
Freshwater animals face the opposite problem from marine vertebrates: their internal osmolarity is higher than the surrounding water. They constantly gain water by osmosis, and lose salts by diffusion. Without osmoregulatory mechanisms, they would swell up with water. Many freshwater fishes drink very little water and excrete copious amounts of very dilute urine (Figure A2.12). They replenish salt lost in their urine by eating and by taking up salt from the water through their gills.

Figure A2.12 Comparison of osmoregulation of marine and freshwater fish.
Osmoregulation in anadromous fish
Anadromous fish such as hilsa move from marine to fresh water and back during their life cycle. They undergo dramatic changes in their environment and their physiology has to change to suit their surroundings.
Catadromous fish, such as eel that go from freshwater to marine waters, are adapted in a very different way. Listen to this fascinating podcast about how scientists have traced where eels go.
- hormone
- Chemicals secreted by endocrine glands that regulate body processes.
- acclimatise
- Adjust to new environmental conditions.
When living in freshwater bodies, hilsa and salmon behave like freshwater fish, excreting large amounts of dilute urine, and taking up salt from their gills. They also produce the hormone prolactin that induces the secretion of mucus to cover their bodies. Mucus reduces the amount of salts leaving the body and water entering the body.22 When the fish go from fresh water to sea water, they acclimatise by entering estuaries, which are a transitional zone between fresh water and sea water. They increase their production of the steroid hormone cortisol, which increases the number and size of salt-secreting chloride cells. Gradually, their osmoregulation becomes more like marine fish. They drink large amounts of water, excrete excess salt through gills and kidneys, and produce only small amounts of urine.23
Locating information
How does one locate information in science? How do we search for and select information that we need, especially when the Internet is full of varied resources?
In the following paragraphs we will do an activity in which we search, filter and cite resources. In earlier days, one would actually go to a library, and use catalogues to search for articles or books on specific topics. In the digital age, access to information is fast, yet finding the right information takes time.
Suppose we want to find out more about hilsa migration for a class assignment. Remember, textbooks are always a reliable source for basic information. But textbooks do not have the scope to cover specialised information, and they become outdated over time. Scientific journals are another source of information. These contain papers written by scientists communicating their latest results and discoveries. New knowledge is first published in peer-reviewed research journals, which are called primary sources of information. Other scientists interrogate and challenge the new knowledge, sometimes changing it in the light of new evidence. Scientific knowledge is therefore dynamic rather than static.
Here are some guidelines to follow when searching for and evaluating information on the Internet. We will use Google as a search engine, since that is the site most commonly used.
An exercise on searching, filtering and citing
-
Generic keywords will result in generic information. Search for hilsa on Google. Did you get advertisements about where to buy hilsa, recipes using hilsa, articles covering the decline of hilsa, and a Wikipedia entry about hilsa?
A search using a generic keyword will result in all kinds of results, and it becomes difficult to extract the right information. It is good to read Wikipedia or an encyclopaedia entry as a starting point to get some information, but please do not stop there.
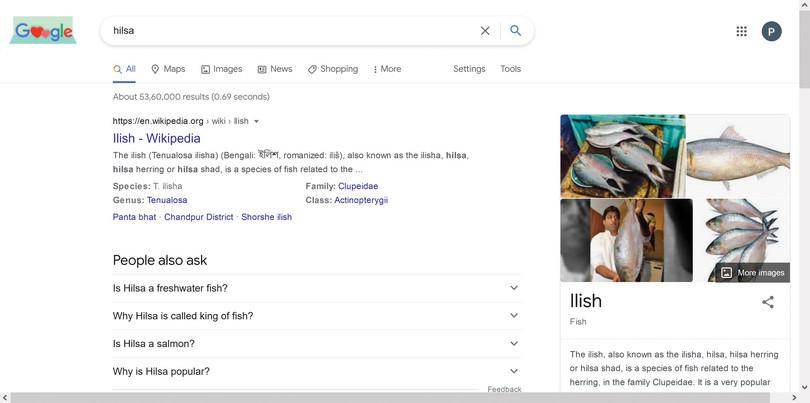
Figure A2.13 Generic keyword search.
-
Refine your search by giving specific keywords. Use specific keywords such as ‘hilsa migration’. Did you get newspaper articles, research papers, or even presentations or assignments posted online by someone?
Many college students in their early years of study make the mistake of using assignments from the Internet, and copy-pasting the information into their own assignments. This is wrong for two reasons: if the copied information is not accurate, then you end up perpetuating the wrong information. Secondly, copying information without acknowledging the source is plagiarism, which is illegal.
It is best to keep away from unreliable sources and do some background reading yourself. Start with information in science magazines or blogs. If you start reading a research article straight away, the technical information can be overwhelming.
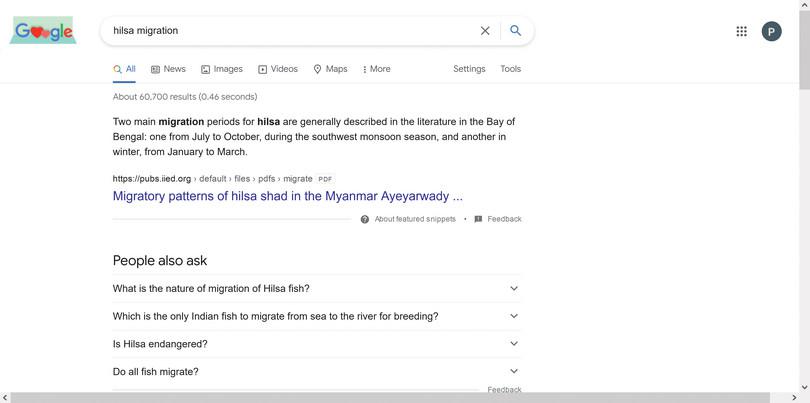
Figure A2.14 Refined keyword search.
-
How do you distinguish reliable sources from unreliable ones? This comes with a bit of practice. Do not get your information from the first sources you find. Search engines like google use an algorithm to determine dynamically which webpage is most relevant, depending on the keyword that you give. Typically, paid advertisements are the first ones to appear. If one just reads the first post that comes up, that information may be biased towards one view, or may be catering to a specific audience.
For this exercise, use information from science magazines or blogs as a reliable source. But you need to check the date on the item, who the author is, where the author comes from, and what kind of articles they write. Published research papers or review articles are reliable sources, but it is best to read those once you have some background information about a topic.
Advanced search techniques
- Search engines to find research papers include Google Scholar and PubMed. These are free, popular search engines for accessing scholarly literature on life sciences and medical sciences. Both sites allow us to access similar information. We have highlighted some useful features of Google Scholar:
- You can ‘filter’ your search based on the year of publication (‘Custom range’ will allow you to do that).
- ‘Cited by’ will give you an idea of how many other researchers have cited that paper. It tells you something about the standing of a particular article in the scientific community.
- It is always good practice to pay attention to the authors. You will quickly notice that some authors will start appearing many times, indicating that they have published and contributed significantly to a field.
- [PDF] on the right-hand side of the page will indicate papers that are freely available as a pdf. Although research is supposed to be easily accessible for everyone, most articles are ‘owned’ by journals, and are not freely accessible.
- The symbol ” that you see circled in the image below gives you different styles that you can use to cite an article. We will come to this later in this exercise.
- You can often find the email address of the author on the journal website, after the title or the abstract. You can request a copy of the full text from the author if you think the article will help your research. Alternatively, you can buy the full text from the journal.
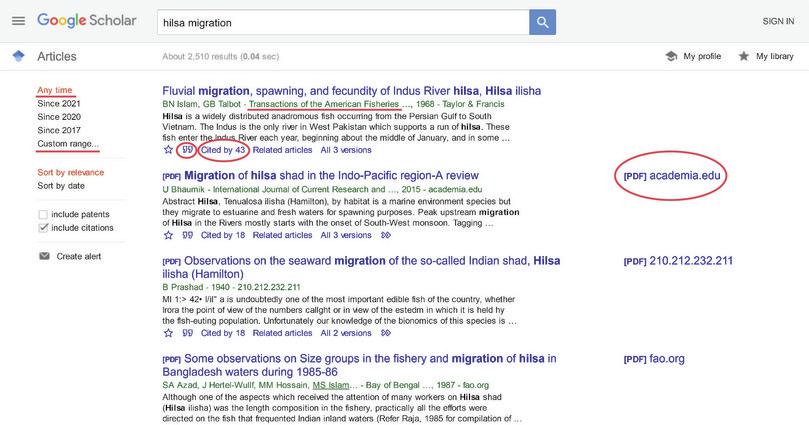
Figure A2.15 Refined keyword search on a search engine.
- Start with review articles. Review articles give a comprehensive overview of the topic. As the name suggest, review articles are supposed to ‘review’, evaluate or assess all previous relevant articles about this topic, summarise the information, and point out controversial areas and/or new avenues to follow. Typically, a review article is written by established researchers who have made a significant contribution to the field. How do we know whether an article is a review or not? Sometimes, the title of the paper may suggest it is a review. If not, read the abstract, which will mention if it is a review or not.
-
Read both recent and classic papers: classic papers will give you a flavour of early ideas about a topic, whereas recent papers will give an idea of how the field has advanced. It is important and essential to read at least one review paper from start to finish. Students sometimes read just the abstract and write assignments. While abstracts will give you the summary of the paper, it is important to read the whole paper.
Reference articles found across all chapters of this book will give you an idea of how to read a research paper. In preparing this chapter, we read Francis Day’s account of hilsa from 1888. This gives us an idea of the status of hilsa in colonial India over 150 years ago.
-
Cite and reference your information: Why should one cite others’ work? By citing, we acknowledge and give credit to the person who has previously worked and provided information on a topic. We show that we are building new knowledge on the base of existing knowledge. Finally, we show that we have consulted a range of literature on the subject of our paper.
Citing papers and formatting references has become very easy, thanks to the various options available on the Internet. The ” feature on Google Scholar allows you to select the referencing style specified by a journal or by your supervisor.
Regardless of referencing style, basic information such as the author name/s, title of the article, year in which it was published, and the journal or publisher who published it are important information. For example, we might say dams obstruct fish migration (Baum 1994, Larinier 2001). That dams obstruct fish migration is a claim. And the references are the evidence supporting our claim. Freeware such as Zotero will manage and format references for you. Here is one way to format references at the end of an article or report.
Baum, ET (1994) Evolution of the Atlantic salmon restoration program in Maine. In S Calabi & A Stout (eds) A hard look at some tough issues (pp. 36–41). Newburryport, MA: New England Salmon Association Publisher
Larinier, M (2001) Environmental issues, dams and fish migration. FAO fisheries technical paper, 419: 45–89
Exercise A2.6 Searching and evaluating information
Scientific tools
- Choose one of your textbooks that you are using this year.
- What is the full title of the textbook?
- When was it published?
- Who were the authors?
- Where was it published?
- Who was the publisher?
- What makes you think this is a reliable source of information?
- Write the reference in an acceptable format for an assignment.
Summary
In this section, we have illustrated an exercise in searching, filtering information and citing references by taking hilsa migration as an example. In the present time, information is abundantly available online. It is important to know what kind of information you need and how to obtain it. We have outlined how to gather the right information using specific key words, and how to cite the information for a scientific assignment, report or an article that you may have to write. But the same procedure is used in all other disciplines as well. Citing is a way of acknowledging the work done previously. Science progresses by small steps, and every new paper adds value to its progress.
A2.8 Quiz
Question A2.1 Choose the correct answer(s)
Earth is often called the blue planet because around 70% of the Earth’s surface is covered in water. The percentage of fresh water on Earth is:
- Less than 10% of the water on Earth is fresh water.
- More than 1% of Earth’s water is fresh water.
- The percent freshwater is ~3%.
- We do not have to calculate an exact amount, but we can estimate a percentage.
Question A2.2 Choose the correct answer(s)
Some indicator species present in the headwaters of a river are:
- Algae are typically present in streams that have pebbles and rocks. Snail, dragonfly larva, and daphnia are present in 1–3 order streams that comprise headwaters.
- Larger predatory fish, turtles and water birds are typically found in higher order rivers.
- All these aquatic insects are typically seen in shallow headwaters.
- River otters and water snakes need larger, deeper water bodies to hunt, so are typically not present in headwaters.
Question A2.3 Choose the correct answer(s)
How do marine fish solve the problem of living in high concentrations of salt water?
- Sea water dehydrates most animals. To adapt to this, fish drink large amounts of salt water, and excrete salt ions through the kidneys and gills.
- Fish excrete excess salt ions through the gills and kidneys.
- Drinking little water will cause dehydration, as the cells need water.
- One way to conserve water is to excrete very little concentrated urine.
Question A2.4 Choose the correct answer(s)
About 3% of the water on Earth is fresh water. Where is the most fresh water found on Earth?
- Lakes constitute around 1% of the freshwater on Earth.
- Rivers constitute around 1% of the freshwater on Earth.
- Glaciers constitute nearly 70% of the freshwater on Earth.
- Wetlands account for around 1% of the freshwater on Earth.
Question A2.5 Choose the correct answer(s)
Hilsa and salmon are anadromous fishes. This means:
- Anadromous fishes are born in fresh water, but spend their adult life in sea water.
- These are catadromous fishes. Eel is a well-known example.
- Anadromous fish are migratory.
- Although this statement is true, it is generic. You need to specify which direction the movement takes.
A2.9 References
-
Grosberg, RK, Vermeij, GJ and Wainwright, PC, ‘Biodiversity in Water and on Land’, Current Biology 22, no. 21 (2012): R900–903, doi: 10.1016/j.cub.2012.09.050. ↩
-
Gleick, PH, ed., Water in Crisis: A Guide to the World’s Fresh Water Resources, (New York: Oxford University Press, 1993). ↩
-
Roskov, Y et al., Species 2000 & ITIS Catalogue of Life, 2019 Annual Checklist (2019), accessed 15 October 2020. ↩
-
May, RM, ‘Biological Diversity: Differences between Land and Sea’, Philosophical Transactions of the Royal Society of London. Series B: Biological Sciences 343, no. 1303 (1994): 105–111, doi: 10.1098/rstb.1994.0014. ↩
-
Bar-On, YM, Phillips, R and Milo, R, ‘The Biomass Distribution on Earth’, Proceedings of the National Academy of Sciences 115, no. 25 (2018): 6506–6511, doi: 10.1073/pnas.1711842115. ↩
-
Burgess, M and Gaines, S, ‘The Scale of Life and Its Lessons for Humanity’, Proceedings of the National Academy of Sciences of the United States of America 115, no. 25 (2018): 6328–6330, doi: 10.1073/pnas.1807019115. ↩
-
Pawlowicz, R, ‘Key Physical Variables in the Ocean: Temperature, Salinity, and Density’, Nature Education Knowledge 4, no. 4 (2013): 13, accessed 21 May 2021. ↩
-
Jensen, FH, Rocco, A, Mansur, RM, Smith, BD, Janik, VM and Madsen, PT, ‘Clicking in Shallow Rivers: Short-Range Echolocation of Irrawaddy and Ganges River Dolphins in a Shallow, Acoustically Complex Habitat’, PLOS ONE 8, no. 4 (2013): e59284, doi: 10.1371/journal.pone.0059284. ↩
-
Kelkar, N, Dey, S, Deshpande, K, Choudhary, SK, Dey, S and Morisaka, T, ‘Foraging and Feeding Ecology of Platanista: An Integrative Review’, Mammal Review 48, no. 3 (2018): 194–208, doi: 10.1111/mam.12124. ↩
-
Vannote, RL, Minshall, GW, Cummins, KW, Sedell, JR and Cushing, CE, ‘The River Continuum Concept’, Canadian Journal of Fisheries and Aquatic Sciences 37, no. 1 (1980): 130–137, doi: 10.1139/f80-017. ↩
-
Ramírez, A and Gutiérrez-Fonseca, PE, ‘Functional Feeding Groups of Aquatic Insect Families in Latin America: A Critical Analysis and Review of Existing Literature’, Revista de Biología Tropical 62 (April 2014): 155–167. ↩
-
Wallace, JB and Webster, JR, ‘The Role of Macroinvertebrates in Stream Ecosystem Function’, Annual Review of Entomology 41, no. 1 (1996): 115–139, doi: 10.1146/annurev.en.41.010196.000555. ↩
-
Greathouse, EA and Pringle, CM, ‘Does the River Continuum Concept Apply on a Tropical Island? Longitudinal Variation in a Puerto Rican Stream’, Canadian Journal of Fisheries and Aquatic Sciences 63 (2006): 134–152, accessed 16 October 2020. ↩
-
Jiang, X, Xiong, J, Xie, Z and Chen, Y, ‘Longitudinal Patterns of Macroinvertebrate Functional Feeding Groups in a Chinese River System: A Test for River Continuum Concept (RCC)’, Quaternary International 244, no. 2 (2011): 289–295, doi:10.1016/j.quaint.2010.08.015. ↩
-
Tomanova, S, Tedesco, PA, Campero, M, Van Damme, PA, Moya, N and Oberdorff, T, ‘Longitudinal and Altitudinal Changes of Macroinvertebrate Functional Feeding Groups in Neotropical Streams: A Test of the River Continuum Concept’, Fundamental and Applied Limnology/Archiv Für Hydrobiologie 170, no. 3 (2007): 233–241, doi: 10.1127/1863-9135/2007/0170-0233. ↩
-
Doretto, A, Piano, E and Larson, CE, ‘The River Continuum Concept: Lessons from the Past and Perspectives for the Future’, Canadian Journal of Fisheries and Aquatic Sciences 77, no. 11 (2020): 1853–1864, doi: 10.1139/cjfas-2020-0039. ↩ ↩2
-
Nautiyal, P, ‘Food Chains of Ganga River Ecosystems in the Himalayas’, Aquatic Ecosystem Health & Management 13, no. 4 (2010): 362–373, doi: 10.1080/14634988.2010.528998. ↩
-
Subramanian, KA and Sivaramakrishnan, KG, Aquatic Insects of India: A Fieldguide (Bangalore: Ashoka Trust for Research in Ecology and Environment, 2007). ↩
-
Miah, SM, ‘Climatic and Anthropogenic Factors Changing Spawning Pattern and Production Zone of Hilsa Fishery in the Bay of Bengal’, Weather and Climate Extremes, 7 (2015): 109–115, doi: 10.1016/j.wace.2015.01.001. ↩ ↩2
-
South Asia Network on Dams, Rivers and People, ‘Dams, Fish and Fishing Communities of the Ganga: Glimpses of the Gangetic Fisheries Primer’ (30 August 2014), accessed 26 September 2020. ↩ ↩2
-
Dudgeon, D, ‘Large-Scale Hydrological Changes in Tropical Asia: Prospects for Riverine Biodiversity: The Construction of Large Dams Will Have an Impact on the Biodiversity of Tropical Asian Rivers and Their Associated Wetlands’, BioScience 50, no. 9 (2000): 793–806, doi: 10.1641/0006-3568(2000)050[0793:lshcit]2.0.co;2. ↩
-
Bhattacharya, S, ‘Crossing the Salt Barrier’, Resonance 3, no. 10 (1998): 59–69, doi: 10.1007/BF02841423. ↩
-
Reece, JB, Urry, LA, Cain, ML, Wasserman, SA, Minorsky, PV and Jackson, RB, Campbell Biology, 10th ed. (Boston: Pearson Education, 2014). ↩

.jpg)