C2 Cotton
C2.1 Introduction
-
Capacities taught in this chapter
Reading and interpretingBotany of cottonScientific processBt cotton: how to assess claims of new technology?Scientific toolsHybrid organisms
Recombinant DNA
Genetic improvements to cotton
How is hybrid cotton produced?
How is Bt cotton produced?Bridging science, society and the environmentHow did cotton agriculture change in colonial times?
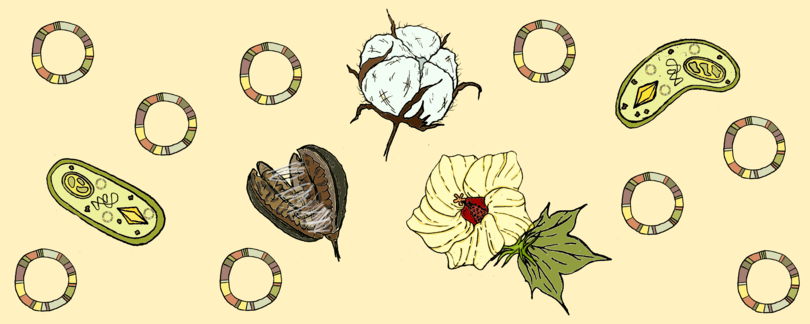
Look at what you and others around you are wearing. It is very likely that the clothes you are wearing are made, at least partially, of cotton. Cotton is central to Indian agriculture and clothing, and India is one of the largest producers of cotton globally.
Cotton belongs to the Gossypium genus in the family Malvaceae. The Gossypium genus has 50 species and the four species from which cotton fibre is derived are Gossypium hirsutum, G. arboreum, G. barbadense and G. herbaceum. Cotton naturally grows in tropical and sub-tropical regions of the world. The plant requires a period of frost-free growth, ample sunshine and a dry climate. Agriculturally it develops best when air temperatures range between 21 and 32°C. It can also survive for short periods at higher temperatures (~37°C). This means that the sub-tropical agricultural zones of India are ideal for its growth, and the three main regions in India are the north zone (Punjab, Haryana, Rajasthan), central zone (Maharashtra, Gujarat, Madhya Pradesh) and south zone (Karnataka, Tamil Nadu).
- alluvial soils
- Very fertile and porous soil deposited on the banks of rivers, in floodplains, and in deltas by flowing water.
- black soils
- Mineral soils enriched in organic carbon, making them fertile and productive.
The growth cycle of the plant from planting to harvest is about five to six months and it requires about 500 mm of rain. It grows in all kinds of soil that are well drained from alluvial soils in North India to the black soils found in south India.
For several centuries cotton has been a driving force of India’s economy due to the large number of people involved in cotton production and processing. Indian cotton weaving is known around the world, from the ikat weavers of south India to the finest muslin of eastern India. See Figure C2.1 for some fine examples of Indian cotton fabrics produced 2 to 3 centuries ago.

Figure C2.1a Seventeenth century hand painted cotton robe.
The Metropolitan Museum of Art, public domain.
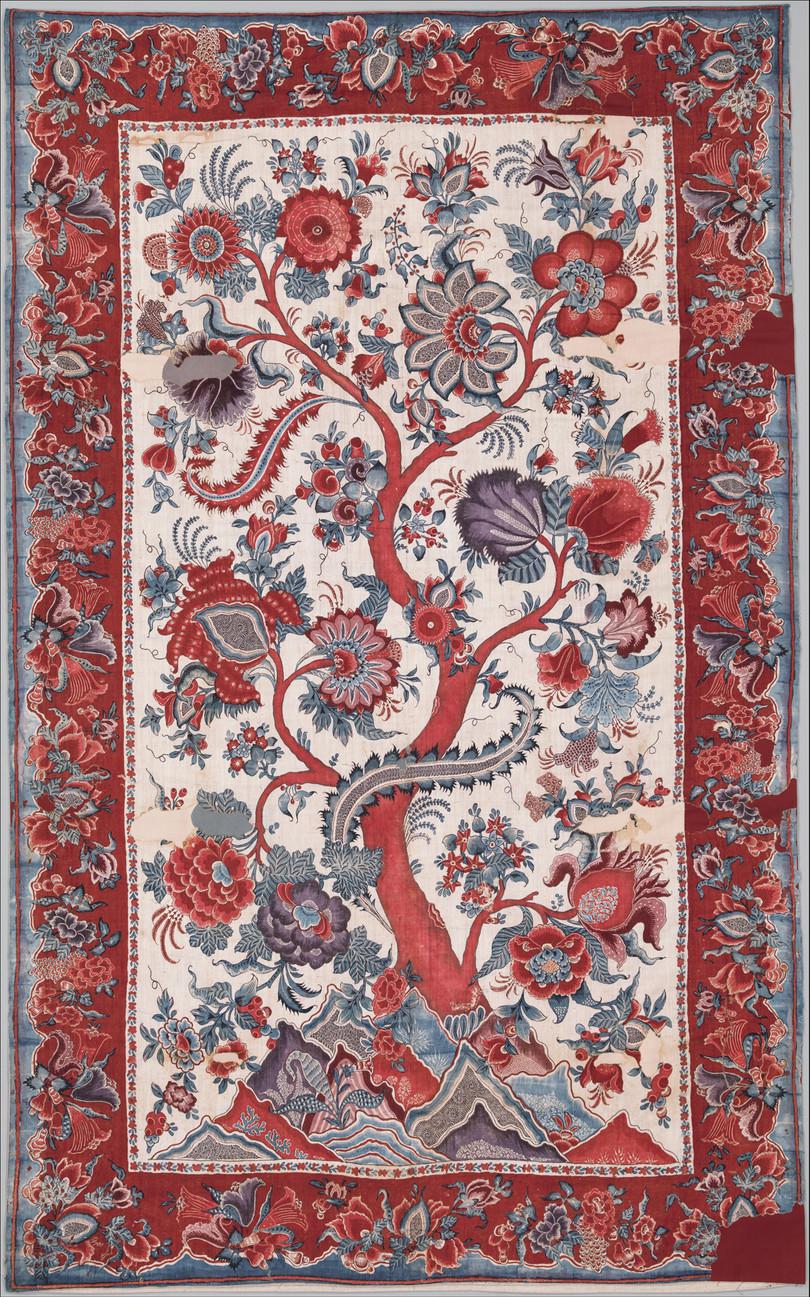
Figure C2.1b Early eighteenth century palampore wall hanging made for the export market.
The Metropolitan Museum of Art, public domain.
- crop yield
- The amount of a crop produced per unit of agricultural area for that crop.
- recombinant DNA
- A DNA molecule artificially developed through the combination of genes from at least two different sources.
The importance of cotton to the economy has led to a great deal of government focus on making improvements to cotton yield via cotton hybrids, investment in fertilisers and pest control, and improved irrigation practices. More recently, recombinant cotton varieties have led to tremendous changes in farming practices.
In this chapter we explore the history of cotton growing in India and understand its centrality to Indian agriculture. We will review how colonial powers attempted to change farming practices in India, and their effect on cotton farming and weaving. By the end of the history section, you will understand how biological, agricultural, cultural, and economic factors decide the success or failure of a crop.
Government focus on increasing cotton yields post-independence led to a large programme on cotton breeding. Such efforts led to the first cotton hybrid ever being produced in India in 1953. In order to study cotton hybrids, we first study the botany of cotton: its physiology and growth characteristics. You might be familiar with some aspects of this from the plant biology you studied in school.
Bacillus thuringiensis (Bt) is a soil bacterium whose proteins are toxins. These have been expressed in crop plants to confer pest resistance.
Studying the biology of hybrid cotton allows us to touch upon many core biological themes and concepts, from classical botany to molecular biology. We study Hybrid-4, the first cotton hybrid that was commercially grown. Hybridisation is widely used in agriculture for improving crop and livestock characteristics. Learning about hybrid production allows us to understand the large-scale increases in crop yields that have been possible in the last 100 years.
We continue to look at scientific advances in cotton growing by studying Bt cotton. Recombinant DNA is now a routine part of basic and applied biology, and the introduction of Bt cotton to India in 2003 has transformed cotton farming. Using the case of Bt cotton, we will understand how this technology first came about and how it is used to produce a recombinant organism. This is one of the scientific techniques that you need to learn from this chapter, as it is based on molecular biology.
The introduction of Bt cotton cannot be separated from the controversy of whether it has benefitted Indian farmers or not. This makes it a good case study for assessing new technology in terms of its benefits and drawbacks to society.
A technology cannot be separated from the claims it makes, and we will therefore learn to evaluate claims in science critically. For this purpose we will use published data on growth of Bt cotton to examine the pros and cons of recombinant DNA technology beyond the simple dichotomy presented in popular media.
The different aspects of cotton growing from its history to scientific advancements are rich in educational and learning potential. In this chapter, we focus on a few of these to enhance capacities in particular areas.
C2.2 Brief history of cotton growing in India
Bridging science, society and the environment
- Old World
- Referring to the continents of Asia, Africa, and Europe.
Cotton in India has a history that goes back at least 4500 years. There is evidence that the Indus Civilisation used cotton fabric. In medieval times, Indian cotton fabric (woven and printed) was famed throughout the Old World. Indian cotton might have accounted for 25% of global industrial output in the Mughal era.1 Travellers such as Marco Polo, Tavernier and the Greeks praised the high quality of desi cotton fabrics.
The pan-Indian cotton industry was thriving and had great value in international trade. A ninth century Arab trader named Sulaiman records, ‘speaking of the town of Calicut … the garments are made in so extraordinary a manner that nowhere else are the like to be seen. These garments are for the most part round, and wove to that degree of fineness that they may be drawn through a ring of middling size’.2
These records and actual fabrics collected by museums and private collectors show that Indian farmers and weavers were skilled in cotton growing, weaving, dyeing and embroidering. Over centuries, farmers honed indigenous methods to cultivate cotton. They carefully selected seeds from plants that could withstand local climatic conditions and pests. Farmers used organic farming techniques to reduce vulnerability to pests while providing high yields.
The resulting fibre produced textiles that were unique to regional climate and culture, and yet had global appeal. Small-scale weavers used techniques specific to their location to clean the cotton, spin the fibres within their own households, and make cloth of varying fineness, depending on the end use. Different regions were known for specific varieties of fabric, from the fine muslins of Bengal to the bright dyed cottons of South India.
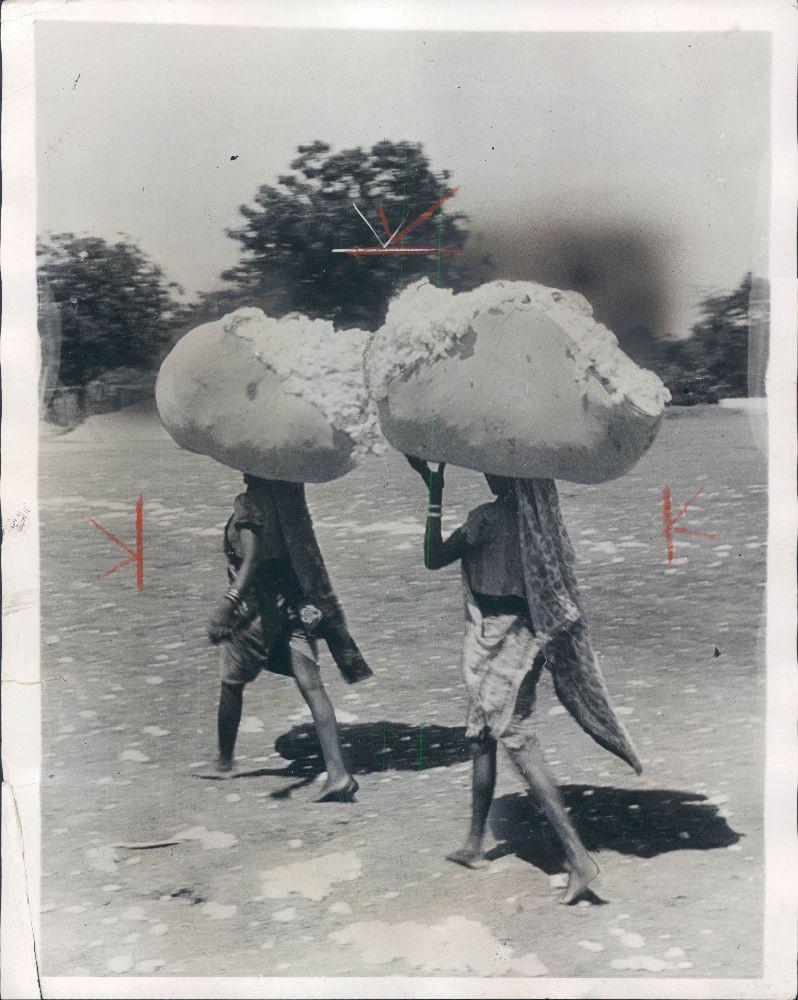
Figure C2.2a Cotton in colonial India – cotton bales being taken from the fields after harvest (1930).
Unknown author, Wikimedia commons, public domain.
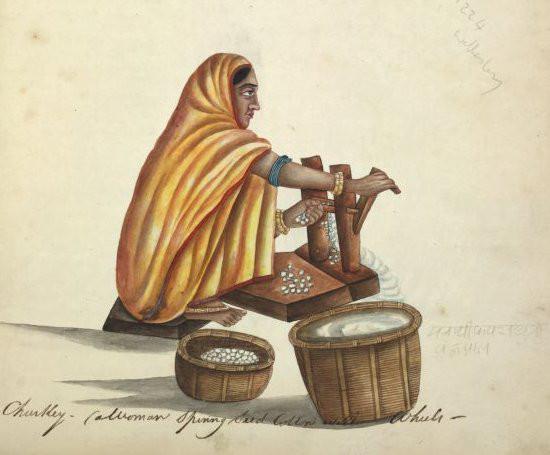
Figure C2.2b Cotton in colonial India – cotton hand-ginning to extract lint.
Unknown author, Wikimedia commons, public domain.
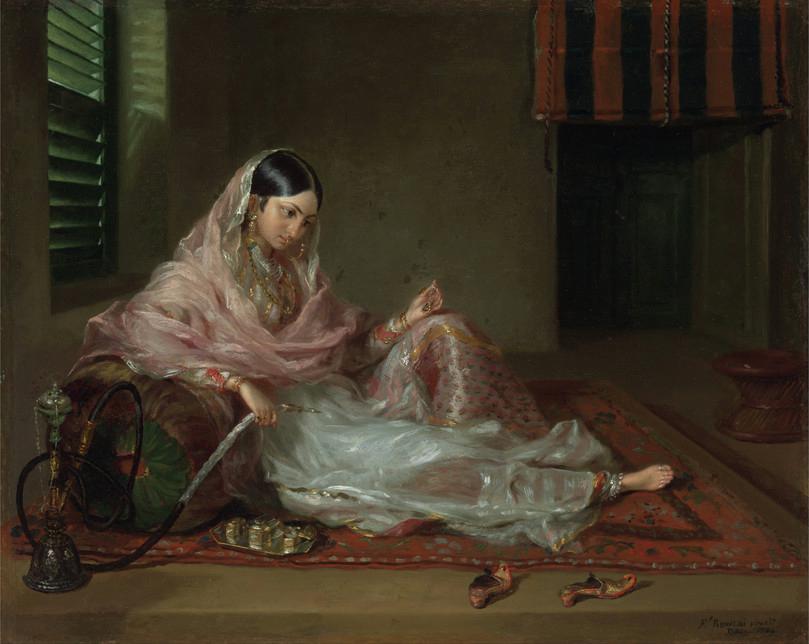
Figure C2.2c Cotton in colonial India – woman wearing fine cotton fabric.
Fransesco Renaldi, Wikimedia commons, public domain.
Cotton production during colonial rule
- cotton gin
- A machine used to separate cotton fibres from cotton seeds.
Colonial rule in India coincided with the Industrial Revolution. In the seventeenth century, before the colonial era, the East India Company had been importing quantities of Indian cotton cloth, such as calico and chintz, and generating large profits. The Industrial Revolution during the eighteenth century produced the cotton gin – (gin is a contraction of engine), which allowed large volumes of cotton fibre to be separated from seeds and prepared for further processing. Other machines could spin larger quantities of fibre into yarn, and cotton mills could weave the yarn into a variety of textiles.
With these technological advancements, the British could produce cotton textiles on a far faster scale than had been done before. They began to meet internal demand for cotton fabric through industrially manufactured cloth and also explored new markets for their cotton products. Newer markets meant the British were keen to scale up the production of cotton to meet the demand from English mills. The main source of raw cotton for the British were their colonies in North America and Egypt. They also looked for alternative sources of raw cotton, including in Africa and the West Indies. By the mid-nineteenth century most of the cotton for global demand came from the United States.
Gossypium hirsutum, the cotton species grown in the United States, was not native to the country. Over the course of 150 years, it had acclimatised to the southern states of America. (G. hirsutum is native to Central America.)
The start of the American Civil war stopped cotton production, and British traders turned to other regions of the world for cotton. British traders looked to India for cheaper and larger quantities of cotton.3
- staple length
- The average length of a group of fibres.
Before the colonial period, Indian farmers grew varieties of Gossypium arboreum and G. herbaceum, which were all short staple length cotton. These indigenous varieties were known as desi cotton. The short staple length, cultivation and trade practices could not supply the large volumes required by cotton gins.
Many attempts were made to replace desi varieties of arboreum and herbaceum cottons with American varieties, mainly Gossypium hirsutum. From the 1790s to well into the nineteenth century, trials with American varieties persisted and failed consistently. American plantation owners also came to India to teach their growing and harvesting techniques to colonial officers, without much success. Some varieties like the Dharwar American did get acclimatised and were grown in South India. In the 1920s and 30s British agricultural officers also worked on improving local varieties, mainly with a view to increasing staple length. To maintain seed purity so as to ensure long staple length of certain varieties, mixed cultivation of varieties was banned. But at the time of independence, the arboreum and herbaceum varieties of cotton were still the major types grown in India, with hirsutum providing only 3% of total yield.4
By the late nineteenth century, India stopped exporting textiles and supplied only raw cotton. British-controlled centralised mills and those set up by Indian industrialists demanded large quantities of raw cotton, and farmers (via traders) increasingly relied on them to buy their cotton harvest. The fact that mills preferred long stapled cotton meant that farmers increasingly shifted to these varieties and the state actively promoted them.
Household spinning and weaving almost disappeared over the course of these 100 years. The damaging effects of colonial practices on Indian cotton cultivation persists even today, especially in terms of loss of biodiversity of native species and destruction of the weaving industry.
Post-colonial developments
After independence in 1947, sociopolitical conditions played a key role in driving agricultural policy. There was a strong drive to grow high-yielding varieties (of all crops, not just cotton) to augment overall income. This led to increased cultivation of hirsutum varieties. Research programmes were also launched to generate cotton hybrids in order to increase yields.
The successful generation of hybrids in India and elsewhere did lead to increasing yields. Hybrids, especially hirsutum hybrids, responded well to pesticides and fertilisers, which contributed to increased yields.
- capital intensive
- Requiring large monetary input.
- pesticide resistance
- The resistance gained by a pest population that makes it less vulnerable to successive applications of pesticides.
Cotton farming became capital intensive because of the onerous cost of hybrid seeds and increasing usage of pesticides and fertilisers. By the late 1990s, yields had stagnated at values far lower than the rest of the world because cotton farming in India was largely rainfed. Pesticide resistance had become rampant because of indiscriminate application of pesticides. Added to this, exposure to large amounts of toxic pesticides led to environmental poisoning. This led to the introduction of Bt cotton in India with government support as a way to attain pest resistance and improve yields. We will see how the introduction of Bt cotton has changed cotton farming in India in the last 20 years.
Summary
In this section we learned about the history of cotton growing in India in the last two centuries. We saw how developments due to the Industrial Revolution, namely mechanised ginning and spinning techniques, led to increased demands for cotton of a particular kind (long staple cotton). India changed from being an exporter of fine cotton textiles into an exporter of raw cotton. Colonial powers also promoted the cultivation of hirsutum varieties although it was found unsuitable for our environmental conditions.
Post-independence government policies promoted the cultivation of hirsutum varieties, since the spinning and weaving industry was geared to using this variety of cotton. Finally, the push to increasing yields also led to the adoption of Bt cotton in 2003. The section highlights the importance of gaining a historical perspective in order to be able to understand the present day state of cotton production.
C2.3 Agro-botany of cotton
Reading and interpreting
To study the biology of cotton, we first need to be familiar with the cotton plant. Barbara McClintock, a famous plant geneticist, said, ‘I start with the seedling, and I don’t want to leave it. I don’t feel I really know the story if I don’t watch the plant all the way along’.5 Let us follow Professor McClintock’s edict and see if we can study cotton all the way from a seed to the production of cotton bolls.
Morphology and growth
Commercial cotton is primarily derived from one species, G. hirsutum (Upland cotton) with G. barbadense (Egyptian or Sea-island cotton) being grown in relatively minor volumes.
The desi cotton varieties derived from G. arboreum and G. herbaceum are grown in India and parts of Asia and Africa, but in much smaller volumes. India is one of the few countries in the world where all four Gossypium species and their hybrids are grown.
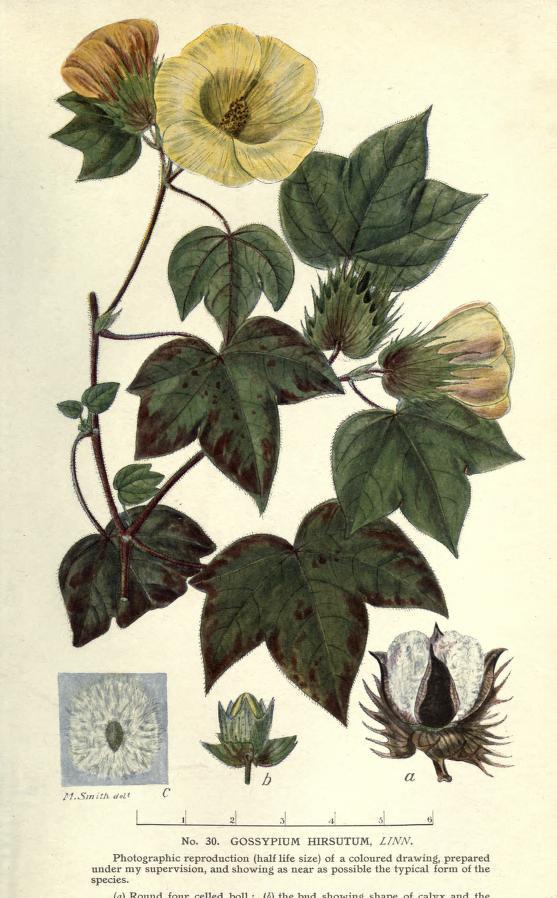
Figure C2.3 Botanical drawings of Gossypium.
Botanical drawing of Gossypium hirsutum
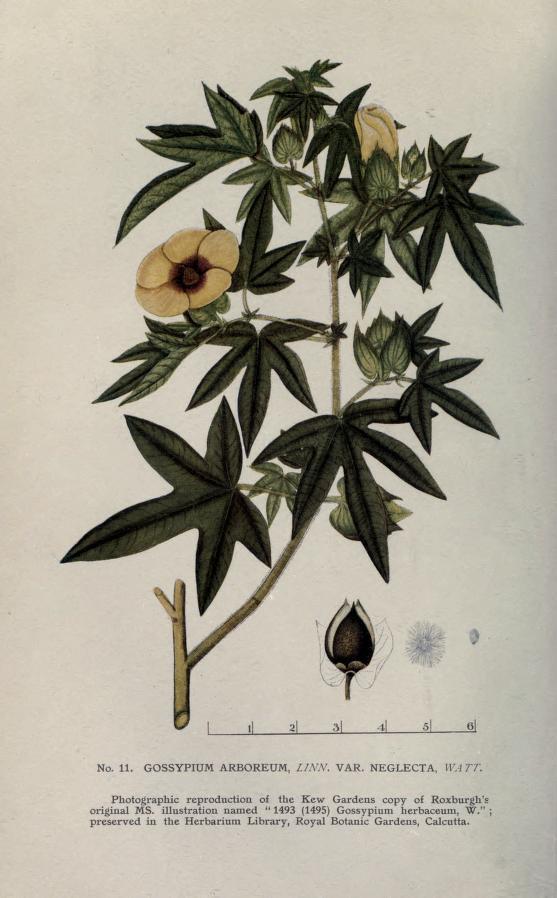
Botanical drawing of Gossypium arboreum
Exercise C2.1 It runs in the family
Scientific process
- Refer to Figure C2.3 and make a list of similarities and differences between the two cotton species.
- Can you list plant species from your locality that are similar to the two cotton species?
- Why do you think we have chosen these historical images?
Extra reading Characteristics of the Malvaceae family of plants
- Commonly called hibiscus or mallow family containing 243 genera with 4225 species of herbs, shrubs and trees.
- Contains a number of economically important plants such as cotton (Gossypium species), okra/bhendi (Abelmoschus esculentus), cacao (Theobroma cacao, used for making chocolate), Hibiscus and durian (Durio species). (Interesting fact: The African Cola species is also part of this family and the caffeine containing seeds are used to make cola drinks.)
- Important fibre-bearing plant species such as cotton and kapok (from Bombax species and Ceiba species).
- Simple leaves (often lobed) arranged alternately and sometimes hairy.
- Flowers are radially symmetrical, showy with pollen-bearing and ovule-bearing parts. They also have prominent bracts forming an epicalyx. Flowers have a central spot (as shown in the photographs).
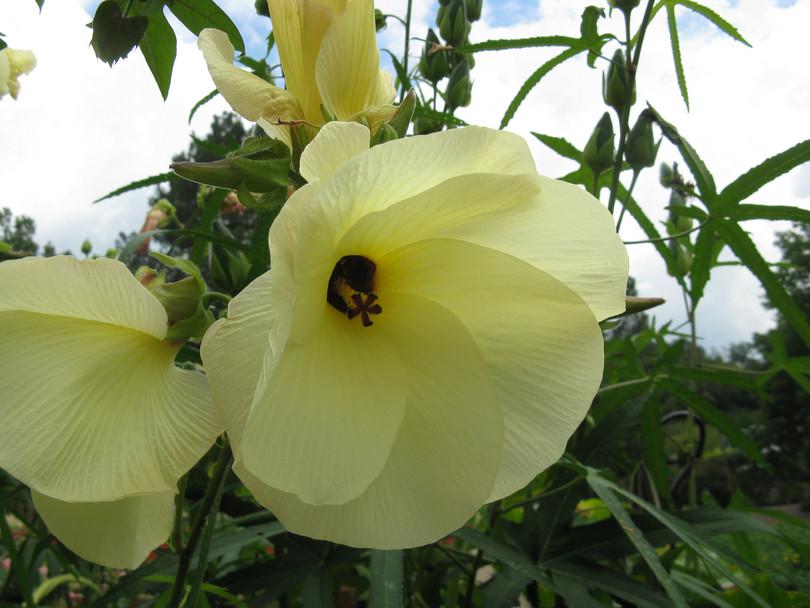
Extra Reading C2.1 Flowers from the Malvaceae family.
a. Kenpei, Wikimedia commons, CC-BY-SA 3.0.
b. Kaustubh Rau.
c. Prenn, Wikimedia commons, CC-BY-SA 3.0.
Gossypium arboreum
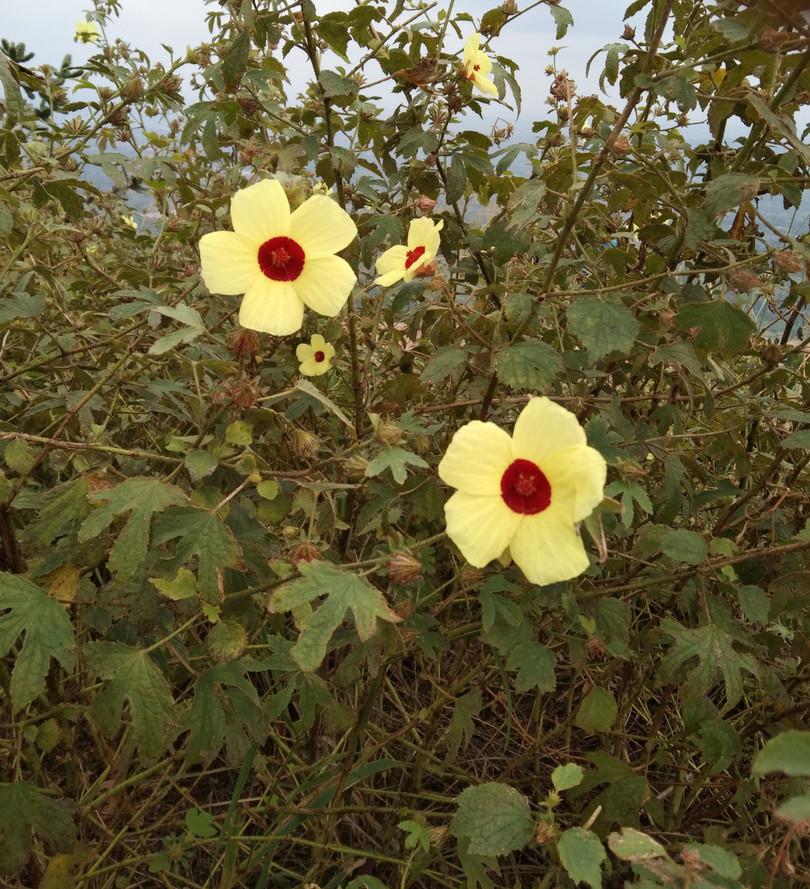
Hibiscus panduriformis
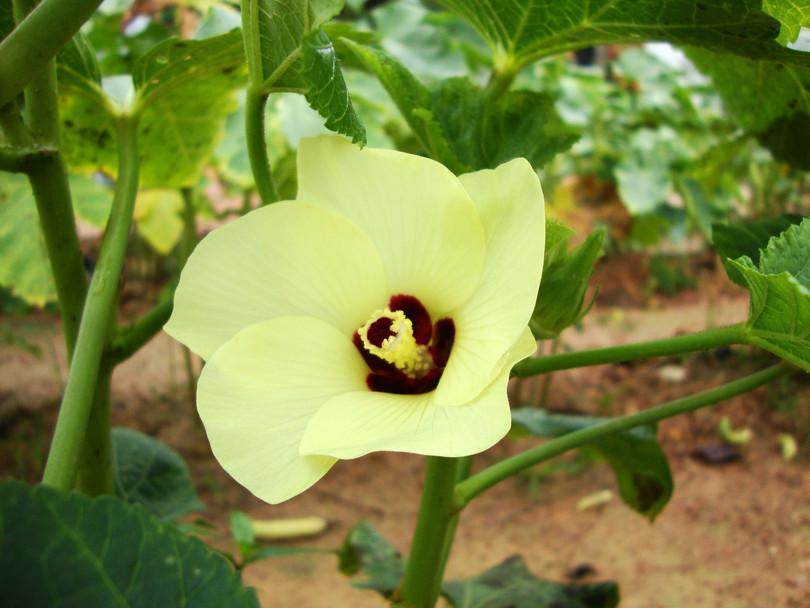
Abelmoschus esculentus
In this section we will study the morphology and growth of Gossypium hirsutum, the long staple cotton that is the dominant species planted worldwide.
This section makes use of several terms in describing the cotton plant. Before reading this section, ask yourself two things:
- Why is it important to identify the varying physical characteristics of plants?
- Why do we name each part of the plant, in other words, what is the point of having so many words and definitions to remember?
- perennial
- Plants that have a life cycle longer than two years. See also: annual.
- annual
- Plants that complete their life cycle in one growing season.
Cotton is a perennial in the wild, meaning that it returns every year in the right season without requiring replanting. It grows as a tree or shrub to 1.5–2 m in height. Commercially it is grown as if it were an annual, so plants are allowed to grow to 1.0–1.5 m and are destroyed after harvesting for fibre and seed.
It has characteristics that are typical of dicots: a taproot, reticulate venation and flowers with five-fold symmetry. Figure C2.4a shows the parts of the flower. Note the similarity and differences between monocot and dicot flowers.
- monopodial growth
- Growth that occurs when the main stem of a plant grows vertically and new leaves grow at the apex. There is one primary apical meristem (the growing tip of a shoot). See also: sympodial growth.
- indeterminate growth (plants)
- Growth that occurs throughout a plant’s life and does not stop.
The main stem of cotton is monopodial and indeterminate. Monopodial means single axis, and indeterminate means there is no definite endpoint to growth.
- sympodial growth
- Growth form characterised by multiple stem branches or apical meristems. See also: monopodial growth.
Lateral branches are produced in a spiral arrangement around the main stem. Lateral branches arise from axillary buds at the base of each leaf and can develop into vegetative or fruiting branches. Fruiting branches develop in a sympodial pattern from vegetative branches and contain flowers. Each sympodial unit consists of a terminal boll‐generating flower, a subtending leaf, and an axillary bud that generates the next sympodial unit. (Refer to Figure C2.4b.)
The number of monopodial to sympodial branches and their branching pattern is important, since the timing of fruiting has to be calculated. The sympodial development of fruiting branches means that the innermost bud of the lowest and oldest branch is the first to open, while the outermost bud of the highest and youngest branch is the last to do so.

Figure C2.4a Parts of a mature cotton flower.

Figure C2.4b Branching pattern on a cotton plant.
Scientific terms are important for scientists to communicate their observations clearly. For example, if you study pollination and fertilisation in cotton plants, you need terms to describe the parts of the flower. Using the terms given above allows you to describe these processes in a concise manner. We should consider our audience when we communicate our work, and use appropriate language.
Pollination and fibre development
Now that we have the appropriate vocabulary to describe plant structure, let us begin to learn about the development of cotton from seed to cotton boll.
Cotton plants are insect pollinated and the pollen is relatively large, heavy and sticky. The main pollinators are honey bees (Apis dorsata, A. florea, A. indica), bumble bees and leaf-cutter bees. Plants are typically self-pollinated (pollination within the same individual), with cross-pollination varying between 0 and 20%.
Fertilisation takes place about one day after pollination. The corolla, along with anthers and filament, drop from the fertilised ovary. Post fertilisation, the seeds develop inside the fruit, called a boll, along with the characteristic cotton lint (cotton microfibrils). From seeding to boll bursting and fibre maturation takes 140 days. Bolls burst 120 days after shoot emergence.

Figure C2.5 Timeline and growth cycle of cotton from seedling to cotton boll.
What is a cotton fibre?
Cotton fibres are single cell extensions of the epidermal layer of the seed which help disperse the seeds. Fibre cells can elongate to 3–6 cm in G. hirsutum, making them some of the largest plant cells in the world!
- anthesis
- The period in a plant life cycle when the flower is entirely open and functional.
Cell development and elongation begins as soon as the plant begins to flower. This flowering period is called anthesis. Cell growth is tracked using days post anthesis (DPA) as the measure.
A cotton fibre cell consists of a cuticle, primary wall, secondary wall, and a hollow lumen (Figure C2.6a). The epidermal cells go through a complex series of changes that involve fibre initiation, cell elongation and synthesis of a secondary wall. This secondary wall is several layers thick and made up almost exclusively of cellulose, forming cotton microfibrils or lint. The properties of this secondary layer determine the quality of the cotton fibre used to make yarn.
In the maturation stage the fibre cells die and the mature fibres twist and entangle to form a three-dimensional network. This twisting and entangling help later in the formation of spinnable yarn. The mature fibre is hollow (‘kidney bean shaped’) and under the microscope has the appearance of a twisted ribbon (Figure C2.6b).

Figure C2.6a The structure of cotton fibre, with the different layers seen in cross section and vertical section.
Adapted from Yu, C, ‘Natural Textile Fibres: Vegetable Fibres’, in Textiles and Fashion: Materials, Design and Technology, ed. R Sinclair, pp. 29–56, Woodhead Publishing Series in Textiles (ScienceDirect, 2015)
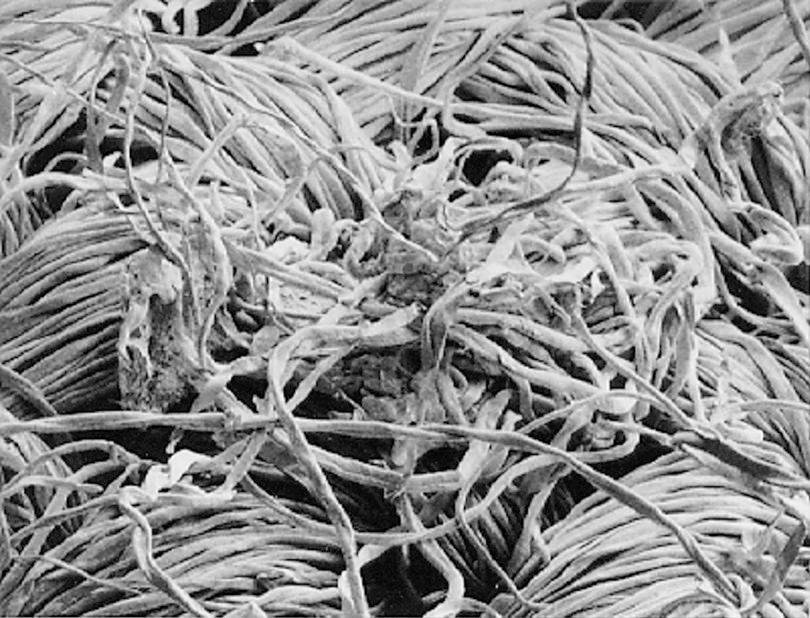
Figure C2.6b A scanning electron microscope image of knotted cotton fibres. Note the flattened shape and natural twist of the fibres. The diameter of cotton fibres varies from 11µm to 22µm.
Bruce Ingber, USDA Agricultural Research Service, public domain
Pests of cotton
- primary pests
- Pests that directly feed and breed on whole, undamaged plant parts.
- secondary pests
- Pests that can only feed on plant parts that have already been damaged by primary pests, or on processed grains.
Over 150 insect species feed on different parts of the plant. Of these only a few can be categorised as pests, in other words, their actions are detrimental to human economic concerns. Two main types of pests attack cotton: sucking pests and bollworms. Cotton pests in India are primarily at the caterpillar stage of the insect life cycle. Caterpillars (which eat the cotton bolls and are called bollworms) are the primary pests, and sap-sucking bugs are secondary pests.
- polyphagous insects
- Insects that feed on plants of diverse taxonomic groups. They are voracious feeders and multiply in large numbers. See also: oligophagous.
- oligophagous
- Feeding on a diverse set of foods. See also: polyphagous insects.
The primary pests that cause the most damage in India6 are the polyphagous Helicoverpa armigera, or American bollworm (ABW, an Old World species) and the oligophagous Pectinophora gossypiella, or pink bollworm (PBW). Sap-sucking bugs suck sap from leaves, and more than 150 species attack cotton.
Pest attacks have a large economic impact for cotton farmers and the cotton industry. Pesticides have contributed to increasing cotton production. However, pesticide resistance has also developed in many pests, meaning that newer pesticides need to be designed to combat this resistance. Methods we have developed to combat these pests may have inadvertently created more problems than they have solved.

Figure C2.7 Lepidopteran pests of cotton. Caterpillars from the bollworm family are the most destructive pests.
Summary
In this section we learned about the characteristics of the cotton plant. Cotton shows several characteristics of the family Malvaceae, particularly the large showy flowers and lobed leaves. We learned about the characteristics of pests that plague cotton; information that is linked to the next section on genetic improvements to cotton.
C2.4 Genetic improvements to cotton
Scientific process Scientific tools
Early in the twentieth century, the rediscovery of Mendel’s laws, which showed how traits were passed from parent to offspring, provided impetus for research in plant hybrids. University agricultural programmes were launched to generate hybrids for several important crops, including cotton. Let us study one of the first such efforts to produce a cotton hybrid.
- polyploid
- A cell containing more than two chromosomes per homologous pair of chromosomes. See also: haploid and diploid.
- allotetraploid genome
- The genome of a hybrid in which each parent contributes a homologous pair of chromosomes instead of a single chromosome. The hybrid has twice as many chromosomes as its diploid counterpart.
- heterosis
- The enhancement of traits in a hybrid offspring that occurs from the mixing of the parents’ genes. Also known as: hybrid vigour.
G. hirsutum and G. barbadense are polyploid, which means they have several copies of each chromosome in every cell. By contrast, humans are diploid, since we have two chromosomes per homologous pair in our genome. G. hirsutum and G. barbadense have an allotetraploid genome, with four sets of chromosomes. This double-duplicated genome provides some advantageous characteristics such as heterosis and gene redundancy (Refer to Figure C2.8).
- dominant gene
- A gene in which only one allele for a character is expressed in a heterozygote.
- hybridisation
- Breeding between individuals of different species or genetically distinct individuals such as varieties of the same species.
- gene redundancy
- Presence of more than one gene that can be expressed to carry out the same function.
Heterosis or hybrid vigour happens because of the accumulation of favourable dominant genes. Hybridisation is the process by which plants cross-breed within the same species or different species. In addition, in a tetraploid genome, gene redundancy allows duplicated genes to be used for other functions, producing advantageous phenotypes.
The long staple length of fibres in the hirsutum and barbadense varieties results from the tetraploid genome. These long staple lengths produce spinnable fibres, which was a major driver for the domestication of these two species. Disadvantages to having a polyploid genome include high pest susceptibility, as seen in cotton.

Figure C2.8 Fibre phenotypes of domesticated allotetraploid cotton (G. hirsutum L. acc. TM-1), wild cotton (G. hirsutum L. acc. yucatanense), and their two closest extant progenitors, G. herbaceum and G. raimondii (scale bar, 10 mm). Note the difference in fibre length between herbaceum and the domesticated tetraploid species (AADD).
Adapted from Zhang, T et al., ‘Sequencing of Allotetraploid Cotton (Gossypium Hirsutum L. Acc. TM-1) Provides a Resource for Fiber Improvement’, Nature Biotechnology 33, no. 5 (2015): 531–537, doi: 10.1038/nbt.3207, CC-BY-NC-SA 4.0.
Crop hybridisation takes advantage of heterosis or hybrid vigour. All domesticated varieties of plants and animals result from hybridisation carried out by farmers and livestock owners for thousands of years. More recently, scientific production of plant and animal hybrids has led to tremendous gains in agriculture and livestock farming in terms of yield, disease resistance and other factors.
In plants the procedure for hybridisation is still the same as Gregor Mendel’s famous studies of pea plant crosses. Conventional hybridisation is the method largely used for producing hybrid cotton seeds.
Agricultural scientists in India and elsewhere explored cotton hybrid production in order to increase yield and fibre quality. The first cotton hybrids in the world were produced in India from the late 1950s. We will look at how Hybrid-4, a well known cotton hybrid, was produced.
Producing cotton Hybrid-4
The original research on producing hybrid cotton was carried out by Prof. C. T. Patel at Gujarat Agricultural University.7 Professor Patel produced three different cotton hybrids, of which Hybrid-4 was a line that was commercialised successfully.
Patel crossed two hirsutum varieties. For the female parent he chose a long-staple Indo-American variety called Gujarat 67. For the male parent he chose an exotic hirsutum variety called American Nectariless. The male parent lacked nectaries, the glands that produce nectar for attracting insects for aiding pollination.
Prof. Patel’s procedure was as follows:
- The plants were grown in separate plots of female and male parents in the proportion of 5 : 1. The sowing time was adjusted so that flower production of both parents was synchronised.
- Prof. Patel emasculated flowers on each female parent plant using Doak’s method.8 In this method, field workers remove the bracts (see Figure C2.4a) by hand. Then, using their thumbnails, they remove the petals along with entire anther sacs. They are careful not to damage the stigma, style or ovary. The emasculation is done in the morning before anther sacs burst. Field workers cover emasculated flowers with a red bag to prevent fertilisation from unwanted pollen, and also for easy identification (see Figure C2.9b).
- Field workers collect flower buds from male plants before they open and remove the bracts and petals. They keep the bud in the sun, allowing the anther sacs to burst open.
- Field workers pollinate between four and five emasculated female flowers with each male flower. The stigma produces a sticky substance that signals its receptivity for pollination (usually between 09:00 and 11:00 in the morning). After cross-pollination, field workers cover the female flowers with a white bag to prevent cross-contamination.
- They make sure that no open flowers remain on the female plant after crossing as this hinders the development of crossed bolls. Similarly, all male flowers are plucked post pollination in order to prevent contamination by natural outcrossing.
- grow out test
- A test of genetic purity in which a large number of plants are grown from hybrid seeds to evaluate whether desirable traits in the hybrid are reproducibly inherited.
Prof. Patel and his group found that 40% to 50% of their attempted crosses were successful. Seeds were certified by testing for germination and a grow out test to check for genetic purity.
Hybrid-4 expressed a high degree of heterosis, as seen by its high productivity (yield). It had extraordinary bearing capacity, bigger boll size, and profuse and continuous flushes (flowering) that overlapped with each other. Importantly, yields were 216% higher than a parent line under optimised conditions.
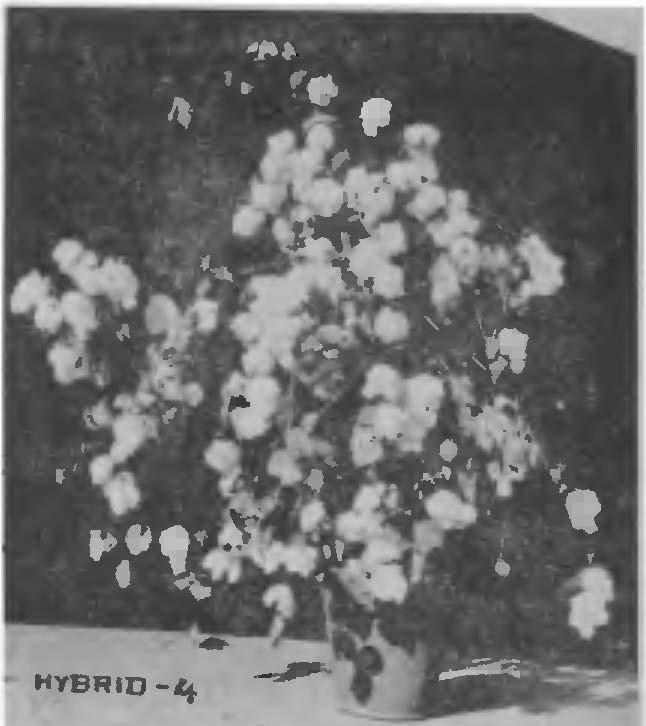
Figure C2.9a Hybrid-4, produced by Gujarat 67 (female) × American Nectariless (male).
Patel, CT, ‘Evolution of Hybrid-4 Cotton’, Current Science 50, no. 8 (1981): 343–346.

Figure C2.9b Doak’s method of hybridisation.
Subsequent to the development of Hybrid-4, many other cotton hybrids were developed by different agricultural universities in India. The excellent performance of the hybrids led to large increases in yield in the years following the green revolution (discussed in the next section).
Summary
This section discussed the process of hybridisation with special focus on the first cotton hybrid. We saw how the hybridisation programme, based on Mendel’s research, resulted in a more productive cotton crop. This experiment is an excellent example of the scientific enterprise. One set of results builds on previous work, which is sometimes a century and thousands of miles away! Cotton hybrids in India subsequently used the success of the Hybrid-4 for the production of many other hybrids.
Exercise C2.2 Hybridisation of cotton
Reading and interpretingScientific process
- Divide your class or study circle into groups and draw a flow diagram showing the steps Patel followed when he produced Hybrid-4 cotton plants.
- What are the advantages of hybridisation in crop plants? Might there be disadvantages, too? Randomly divide the groups into pro-hybridisation and anti-hybridisation groups. How will you convince other groups of the advantages or disadvantages of hybridisation in crop plants? What types of information sources will you rely on to construct your argument?
- Summarise the advantages of Hybrid-4 in cotton production.
C2.5 Genetic improvements in cotton: producing Bt cotton
Scientific process Reading and interpreting
As seen in the previous section, a cotton hybrid was first produced in India. With the advent of the green revolution in the late 1960s to early 1970s, the use of fertilisers and pesticides for increasing yields became common practice in agriculture.
- molecular cloning
- A procedure used to replicate recombinant DNA within a host. See also: recombinant DNA and vector (biotechnology).
Chemically intensive agriculture spread to cash crops like cotton. By the 1980s, pesticide resistance was increasing worldwide to a wide range of pests, with cotton pests proving to be particularly resistant. Scientists turned to the emerging technology of molecular cloning to produce a better plant with improved pest resistance. In this section we will go into the development of Bt cotton in depth.
Introduction to recombinant DNA: processes of science
- animal cell culture
- Animal cells grown in controlled, artificial environments.
Recombinant DNA technology began in Paul Berg’s laboratory at Stanford University. Berg had worked in Rennato Dulbecco’s lab, which had pioneered techniques of animal cell culture.
- vector (biotechnology)
- A DNA molecule, like a plasmid, used to carry foreign genes into a cell so that they can be expressed in that cell. See also: host.
The Dulbecco lab had shown that viruses could induce cancerous states in cells they infect by integrating themselves into the host genome, causing it to make more copies of the virus. Drawing on this, Dr Berg wondered whether the virus SV40 could be used as a vector to carry foreign DNA into mammalian cells.
Berg and co-workers carried out a historic experiment in gene splicing in 1971. In the experiment, two different pieces of viral DNA – simian virus 40 (SV40) and the bacterial virus, lambda (λ) – were mixed and joined together to form modified SV40. Dr Berg’s idea was to infect bacteria with modified SV40. The infected bacteria would reproduce, amplifying the modified SV40.9
The experiment hinged on three enzymes that had been previously discovered:
- endonucleases
- Enzymes that cut DNA.
- restriction enzymes/restriction endonucleases
- Enzymes that cleave the DNA strands at specific recognition or restriction sites.
- DNA ligase
- An enzyme essential for DNA replication that attaches DNA fragments together and facilitates the formation of the phosphodiester bond in the backbone of the DNA strand.
- terminal transferase
- A type of DNA polymerase that facilitates attachment of nucleotides to the 3’ end of a DNA strand.
- endonucleases (or restriction enzymes) that produced breaks in DNA
- DNA ligase that could join two complementary pieces of DNA
- terminal transferase that could add nucleotides to the 3’ end of DNA.
The experiment scheme is shown below in Figure C2.10.
- sucrose gradient column
- A column consisting of layers of sucrose representing differing densities used to separate small molecules like nucleic acids and proteins.
- The endonuclease EcoRI was used to produce breaks in SV40 and bacterial virus λ to make two linear DNA molecules.
- Terminal transferase then added deoxynucleotides, namely triphosphate adenine (dATP) or thymine (dTTP), to SV40 to produce a polynucleotide tail at the 3’ end.
- The complementary nucleotide (either dATP or dTTP) was added to virus λ to again produce a polynucleotide end.
- These DNA molecules were then incubated together with DNA ligase. The enzyme joined DNA fragments due to hydrogen bonding of complementary nucleotide ends.
- The recombinant DNA molecule (SV40 + λ) was expected to be longer than the original SV40 molecule, and this was confirmed on a sucrose gradient column.
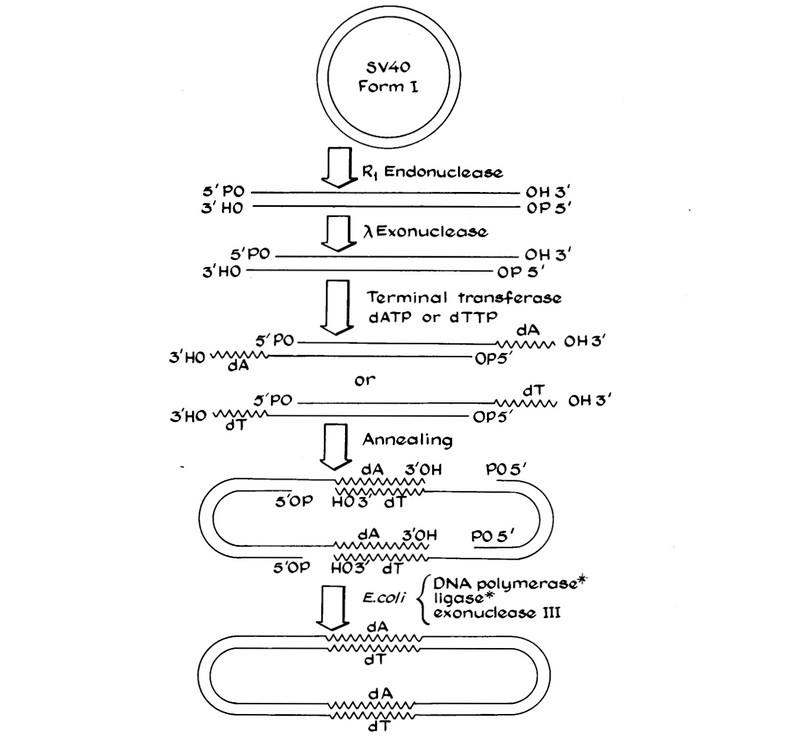
Figure C2.10 Schematic of method for recombinant DNA production.
Jackson, DA, Symons, RH, and Berg, P, ‘Biochemical Method for Inserting New Genetic Information into DNA of Simian Virus 40: Circular SV40 DNA Molecules Containing Lambda Phage Genes and the Galactose Operon of Escherichia Coli’, Proceedings of the National Academy of Sciences 69, no. 10 (1972): 2904–2909, doi: 10.1073/pnas.69.10.2904.
Hear about making the first recombinant DNA molecule from Berg himself, in this video.
Berg’s technique produced a recombinant DNA molecule and showed it could be taken up by bacteria. This process is called transformation.
To familiarise yourself with some of the terms used in this section please take a look at the primer on molecular biology.
Boyer and Cohen (1973) extended Berg’s procedure in a second landmark experiment. Dr Boyer’s lab had originally supplied Paul Berg with the restriction enzyme EcoRI to do the recombinant DNA experiment.10
Boyer and Cohen recognised that EcoRI produced DNA breaks only at a specific sites. They extended Berg’s experiment by recombining genes from two different bacterial strains into one DNA molecule and using it to transform a bacterium. Because they knew that the restriction enzyme made cuts in the DNA at specific sites, they did not need to add complementary nucleotides as Berg had done in his experiment. As shown in Figure C2.11, they essentially ‘cut’ plasmid DNA with EcoRI and ‘pasted’ different bits together with DNA ligase. They then inserted this recombined DNA molecule into E. coli bacteria, allowing it to express the recombined DNA.
Boyer and Cohen’s work benefited from two recent developments in molecular biology:
- the heat shock method developed by Mandel and Higa for increasing the uptake of foreign DNA by bacteria
- gel electrophoresis for separating DNA fragments of different sizes while using ethidium bromide for visualisation.

Figure C2.11 Schematic representation of recombinant bacteria production
- eukaryote
- Single-celled or multicellular organism whose cell contains a distinct nucleus surrounded by a membrane.
A year later, Cohen’s lab combined a plasmid pSC101 along with DNA from the African clawed toad Xenopus laevis to produce a plasmid containing eukaryotic DNA.11 Previously, they had shown that bacteria could replicate a recombinant plasmid. Cohen’s experiments showed that recombinant technology was feasible across biological domains. Many labs from around the world immediately began to work on this technology.
You should take away two main points about the processes of science from this section:
- All of our scientific knowledge is essentially produced as a result of teamwork. This team stretches across humanity and time.
- It is important to make connections across disciplines. Discovering that viruses could lead to cancer (a bad outcome for human health), actually led to a whole new field: biotechnology.
Recombinant DNA technology in plants
The Cohen and Boyer experiment led to the birth of the biotech industry, as it showed a robust method to produce recombinant DNA. Plant scientists recognised the potential of using this technology to confer pest resistance on plants. They began to explore ways to introduce these pest resistence genes into economically important plants.
An important early report on the introduction and expression of foreign genes in plants, that also led to the development of Bt cotton, is the paper ‘A Simple and General Method for Transferring Genes into Plants’.12
This paper described a plasmid and vector system for transforming tomato, petunia and tobacco plants in order to confer antibiotic resistance to them. The scientists chose to introduce antibiotic resistance genes into these plants as proof-of-concept. The paper also showed that these changes were heritable. In this experiment, a soil bacterium called Agrobacterium tumefaciens was the vector used to deliver foreign genes into the target plants.
Agrobacterium tumefaciens is a bacterium species that causes crown gall disease in a wide variety of plants. It can insert a T-DNA (transfer DNA, a short segment of DNA) from the Ti plasmid into the plant host. The T-DNA can then become incorporated into the host genome.
The Ti plasmid is a versatile system that contains a variety of genes both for virulence and for metabolic activity of the bacterium. It is a large plasmid of 200 kilobases (kb) and about 200 genes. Table C2.1 summarises the gene regions found in the Ti plasmid and their functions.
- promoter
- A region of DNA that precedes a DNA sequence that is going to be expressed. Specific proteins bind to the promoter to initiate transcription of the sequence.

Figure C2.12 Schematic of Ti plasmid. Typically a 35S cauliflower mosaic virus promoter is used in front of the gene of interest, as it is a strong promoter.
- auxin
- A plant hormone that is primarily responsible for root and shoot growth through cell elongation, but has other functions too.
- cytokinin
- A plant hormone that regulates cell division, among other functions.
| Ti region | Function |
|---|---|
| T-DNA region | Genes for auxin (aux) and cytokinin (cyt) and opine synthesis (ocs). Auxin and cytokinin are plant hormones. |
| Virulence region | Genes responsible for excision, transfer and integration of T-DNA into the plant genome. |
| Opine catabolism region | Genes responsible for catabolism of opines, a class of amino acids that serve as a source of nitrogen and carbon for the bacterium. |
Table C2.1 Regions and functions of the Ti plasmid.
- origin of transfer
- A region of DNA that is transferred along with the DNA sequence when DNA from one host is introduced into another, as is done during molecular cloning.
Apart from these three main regions, the plasmid also contains an origin of transfer (oriT). The T-DNA region uses the phytohormones auxin and cytokinin to induce uncontrolled cell division in the host plant cell. The right border sequence is important for inducing virulence.
Recombinant DNA experiments modify the Ti plasmid by deleting the T-DNA region. This ensures that the bacterium cannot induce uncontrolled growth due to hormone production in the host. The virulence region is maintained so that integration into the host is achieved. The gene of interest (GOI) is inserted between the right and left border sequences of the T-DNA region. This creates a new Ti plasmid that is capable of entering and integrating with the host genome but is avirulent, thus allowing for transfer of DNA between organisms.
In a natural environment, A. tumefaciens enters the host plant at a wound site. (We normally see gall tumours on leaves or trunks.) For producing an engineered plant, A. tumefaciens is grown in the lab on petri dishes. A plant part which can be a leaf, root or stem, depending on the plant, is kept in contact with the bacterial plate for up to 24 hours. It is then transferred to a new plate that contains an antibiotic that acts as a selectant.
- callus
- A mass of undifferentiated plant cells whose growth can be artificially induced in the lab.
Only plants that have taken up the Ti plasmid containing the antibiotic resistance gene are able to grow on this plate. Then these calluses (developing plant embryos) are transferred to media that induce shoot and root growth, leading to the development of an engineered plant.

Figure C2.13 Schematic of Agrobacterium tumefaciens inoculation and engineered plant growth.
Recombinant DNA technology has evolved for many applications, from medicine to agriculture to biofuel production. The fact that all living things share the same language – the sequence of nucleic acids – to store information means that practically any gene can be taken from one organism and transferred to another. While this should invoke a sense of wonder in how interconnected all life is, it should also serve as a warning to us about how easy it is to modify living things and their traits. Think about why this last point is important.
Development of Bt cotton
Over 150 insect species attack cotton plants. These insects can attack different parts of the plant, at different growth stages. The cotton bollworm complex is particularly harmful to the crop as the pests bore into the cotton boll, ruining the most economically valuable part of the plant.
The only way to control this pest is through several rounds of pesticide application. This is not financially viable for farmers, especially in India with its small land holdings. Pesticides also lead to tremendous ecological damage by persisting in the environment for many years.
Recombinant DNA technology and pest resistance in cotton
Genetically engineered cotton, resistant to bollworm attack, has great potential in insect control since it does away with the problems accompanying pesticides. In this section we will discover how Bacillus thuringiensis (Bt), a gram-positive bacterium, was exploited using recombinant DNA technology to create pest resistant cotton.
Bt is largely soil dwelling, but also grows on leaf surfaces and has been found in flour dust. It is found almost everywhere in the world and there are several hundred Bt strains. The bacterium causes disease or death in various insect species and it began to be used as a pesticide as early as the 1930s. Bt was particularly effective against the destructive larval stage of pest insects.
- δ-endotoxin
- An insecticidal toxin produced by B. thuringiensis and expressed in Bt cotton.
Scientists have discovered many strains of Bt, capable of producing over 700 different toxins. Bacterial spores produce crystal proteins that contain the toxin (δ-endotoxin) (see Figure C2.14). Scientists identified the genes for producing these crystal proteins and found that they occur on plasmids. Their function was therefore related to bacterial resistance and survival.
Industrial agriculture from the 1950s onwards led to increasing amounts of fertilisers and pesticides being used in food production. By the 1980s, pesticide resistance was a known phenomenon and Bt sprays gained popularity. Bt was seen to be an ‘organic’ method for controlling pests.
A pesticide is used against all pests such as fungus, bacteria and insects. An insecticide is specifically used against insects. Based on the study we cite, we have used the word chosen by the authors.

Figure C2.14 Timeline of discoveries related to Bacillus thuringiensis.

Figure C2.15 Cells of Bt containing Bt spores and crystals
Cry toxins and insecticidal action
The lifecycle of Bt has two phases: vegetative cell development/growth and spore development. The vegetative cell is rod shaped (1–2 μm length, 0.5 μm width) and divides into two symmetric daughter cells, as is typical of bacterial cell division.
Spore development occurs when vegetative cells form spores during unfavourable environmental conditions (such as desiccation or high heat). It involves asymmetric cell division and has a complex cycle with different stages. The spore is a dormant stage in the life cycle of the organism.
When Bt spores start developing, the bacterium synthesises crystal proteins as inclusions (see Figure C2.15). Crystal proteins can constitute up to 50% of the cell’s dry weight. We do not completely understand why Bt strains produce these crystals during spore formation.
- cry genes
- A family of genes in Bacillus thuringiensis that produce cry proteins which act against specific insect taxa.
- cry proteins
- Proteins produced by the cry genes from Bacillus thuringiensis that form toxins that result in the death of the target insect.
While many Bt crystal proteins have insecticidal action, others have no effect on insects. Scientists have identified around 500 cry genes that encode information to make crystal proteins. The Cry proteins produced by cry genes target specific insects.
Insects normally ingest bacterial spores containing a large amount of Cry protein when feeding on leaves or other plant parts. Digestion and breakdown of Cry proteins in the high pH environment of the insect gut releases the Cry protoxin.
The Cry protoxin, which is a precursor of the Cry protein, binds to specific receptors on the cell membrane of the insect gut. The Cry protoxin is then inserted into the cell membrane and subsequently, pores form. The pores allow bacterial spores to enter the insect digestive tract and multiply. Bacteria in the insect gut eventually kill the larva. The whole process takes between one and two days, during which time the larva stops feeding.
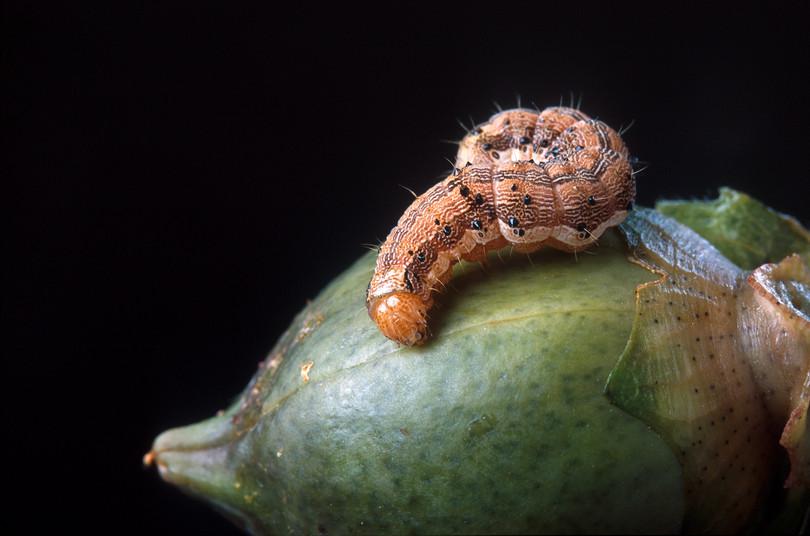
Figure C2.16 Effect of Bt crystal proteins on cotton pests.
Peggy Greb, USDA Agricultural Research Service, public domain.
Effect of normal diet
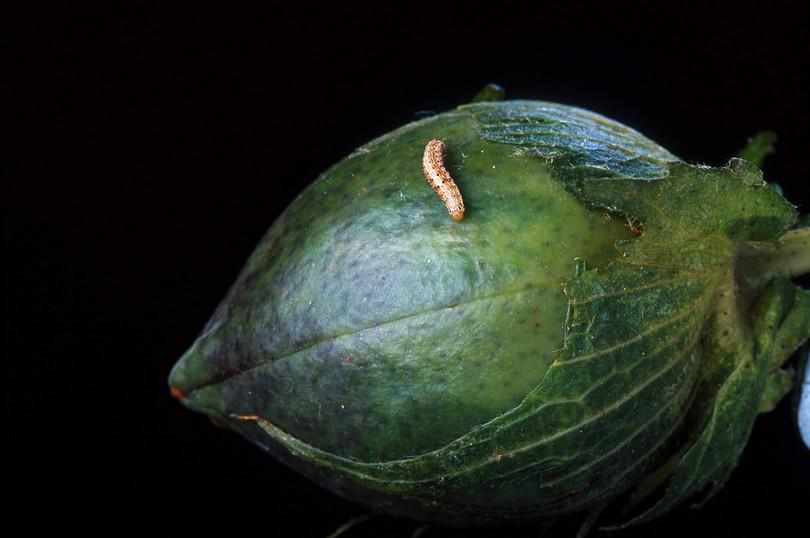
Effect of Bt diet
Cry toxins have several features that make them advantageous as insecticides for agriculture:
- They have to be ingested and are not toxic if they are applied topically, so the spray does not endanger farm workers who come into contact with it.
- They exhibit a high level of specificity. Therefore, farmers can use toxins for specific pest insects, minimising off-target effects on beneficial insects.
- The insect stops feeding within a few hours of ingesting Cry protein, thus saving the plant from damage. Death follows in two days.
- Cry toxins have no known effects, either toxicological or carcinogenic, on vertebrates, especially mammals.
Development of transgenic cotton
The advantages of Cry proteins led to great interest in their use for pest resistance, and especially for the use of Bt toxins in developing transgenic plants. Bt protein cry1Aa was successfully cloned and expressed in E. coli in 1981. The protein retained its insecticidal activity. A truncated version of the protein was also expressed in E. coli and also retained its insecticidal activity.
- in planta
- Within the plant, instead of using tissue cultures.
Initially, Bt proteins were poorly expressed in plants and the plants did not have significant insect resistance. Scientists solved this problem by making a synthetic Bt gene that was truncated by deleting a sequence of DNA. Protein expression increased and in planta synthetic gene expression was first reported in cotton. Synthetic Bt genes gave greater insect protection to transgenic plants than to control plants.
After several years of testing, Monsanto, an agrochemicals company, decided to develop transgenic Bollgard cotton varieties. This cotton line (Bollgard I) was transformed with a vector containing a synthetic Cry1Ac-like Bt coding sequence. Bollgard II cotton, a second-generation product, contains two cry genes that express Cry1Ac and CryIIAb proteins. The dual gene cultivars were expected to provide broader control over a wide variety of insects.
More recently, several new cotton varieties have been introduced that have three Cry proteins in them, using a technology called gene stacking.
Summary
While journeying through the story of recombinant DNA technology, we learned about how science is actually an endeavour that connects all of us. Scientists build on each other’s experiments, across space and time. We then learned about seminal work that eventually led to the establishment of a new field of biology: biotechnology. This led to the development of Bt cotton, a pest resistant crop that could help farmers increase their yield while lowering their insecticide. Next we will try to evaluate this new technology by assessing its long-term impact.
Exercise C2.3 Understanding Berg’s experiment
Scientific process
- What was the impetus for Paul Berg’s experiment?
- Berg and Cohen used plasmids from two different E. coli strains for their experiment. One plasmid carried the gene to confer resistance to the antibiotic kanamycin, and the other plasmid carried the gene conferring resistance to tetracycline. What do you think they did to check if their recombinant strategy worked?
- Make a flowchart to show the process of how Bt toxins infect cells.
C2.6 Impact of Bt cotton in India
Bridging science, society and the environment
- proprietary
- Belonging to or being owned by an entity.
In the previous section, you learned about the molecular basis for Bt cotton pest resistance. Bt cotton was officially introduced in central and southern India in 2002, and in northern India in 2005. By 2011, 93% of cotton cultivated in India was Bt cotton. The Bt gene is proprietary to Monsanto, a multinational company that operates in India through its local subsidiary, Mahyco Monsanto Biotech (MMB). Since Monsanto owns the intellectual property describing the gene, the company receives royalties for every seed containing the gene that is sold.
How do we assess a technology?
Opinions on the success of Bt cotton lie between two extremes. At one extreme, farmers are thought to have achieved moderate to high increases in yield, accompanied by economic stability. At the other extreme, it is thought that Bt cotton has directly or indirectly led to several farmer suicides due to the increased capital investment required and decreasing farmer profit. However, these impacts, positive and negative, are strongly debated.13 14 15
The opposing narratives are illustrated in Figure C2.17. As you can see, each narrative stems from different origins and concerns. This immediately raises larger questions about sources of knowledge, how we collect evidence, its social context, authenticity and interpretation.

Figure C2.17 Two branches of narratives on the success of Bt cotton. How does one decide which narrative to believe when each has its own inherent bias?
Figure C2.17 presents claims for and against Bt cotton. To evaluate the claims, we need to study data and reach our own conclusions. Figure C2.18 shows a graph of cotton yields in million tonnes between 1950 and 2010. Also plotted is the percentage area under Bt cotton cultivation from 2003 to 2010 (so this graph has two y-axes). We see that a rise in the percentage of Bt cotton area coincides strongly with a rise in cotton yield.
At first glance, one might conclude that an increase in Bt cotton area caused (or at least is strongly correlated with) a strong increase in cotton yield. How can we verify this hypothesis?

Figure C2.18 Production area for Bt cotton and cotton production from 1952 to 2010. Note that the figure has two y-axes.
Adapted from Kranthi, KR and Stone, GD, ‘Long-Term Impacts of Bt Cotton in India’, Nature Plants 6, no. 3 (2020): 188–196, doi: 10.1038/s41477-020-0615-5.
Investigating the relationship between Bt cotton area and cotton production
Figure C2.18 clearly shows a strong increase in the area under Bt cotton and cotton production after 2002. Here, we will evaluate the relationship between area under Bt cotton and cotton production through systematic critique. Each observation raises follow-up questions which explore possible bias in the data.
| Potential critique | Follow up question | Bias |
|---|---|---|
| Are all farmers who adopted Bt cotton equivalent in wealth, land area, level of education, or any other socioeconomic measure? | Are all treatments of Bt cotton vs. non Bt cotton equivalent? | Selection bias |
| How did the yield on the same plots differ before Bt cotton adoption and immediately after? | Did farmers plant Bt cotton seeds (which are more expensive and from which higher yields were thought possible) on the same plots or did they select their ‘best plots’ (the plots that were most fertile for example). | Cultivation bias |
| The plot shows a strong increase in yield up to 2010 after the 2002 introduction of Bt cotton. How has the yield changed since 2010? | If long-term yields have changed is it because of Bt or other practices (e.g. use of pesticides or fertilisers)? | Time-term bias |
Table C2.2 Investigating biases.
Adapted from Kranthi, KR, and Stone, GD. ‘Long-Term Impacts of Bt Cotton in India’, Nature Plants 6, no. 3 (2020): 188–196, doi: 10.1038/s41477-020-0615-5.
Each of the questions in Table C2.2 reveals potential biases that Figure C2.18 obscures. Therefore, Figure C2.18 cannot directly address our hypothesis. Furthermore, Figure C2.18 does not reveal whether there is any variation across the country. Since the cultivation methods, climate and soil conditions vary considerably across India, the impact of the environment on yield is also relevant.
We now turn to a study on the long-term impacts of Bt cotton in India. The researchers have systematically addressed the biases mentioned in Table C2.2 to reach a verifiable conclusion.
Has Bt cotton increased yield or not?
- longitudinal data
- Data taken from a single sample or site that is studied over time.
Kranthi and Stone used longitudinal data over 20 years (3 years preceding the introduction of Bt cotton, and 17 subsequent years) of cotton yield.6 They recognised that within India, government regulations, climate, farming practices and other environmental conditions may vary. Therefore, rather than pooling data from all states that grow Bt cotton, they conducted a comparative study across different states.
Exercise C2.4 Quantitative reasoning to understand effects of individual versus pooled data
Scientific processQuantitative skillsLook at the table showing figures for cotton production for three states and for all of India for the years 2017 to 2018. The data shown is for two states that are among the biggest cotton producers (Gujarat and Maharashtra) and for one minor producer (Punjab).16
State Cotton area (lakh hectares) Cotton yield (lakh bales) Cotton productivity (kg/hectare) Punjab 2.91 11.5 671 Gujarat 26.23 104 674 Maharashtra 42.07 85 343 All India 124.44 370 505.46
- What percentage do Gujarat and Maharashtra contribute to the All India cotton area under cultivation?
- Compare Gujarat and Maharashtra’s yields. How much greater is Gujarat’s yield than Maharashtra’s?
- What percentage is Maharashtra’s productivity compared to Gujarat’s? Why might Maharashtra have such low productivity?
- Calculate Punjab’s area under cotton cultivation as percentage of the All India total.
- Calculate Punjab’s percentage of the total yield.
- Speculate on why Punjab’s cotton productivity is among the highest among all states.
Examining state-wise data allows us to determine the differences between different cotton-growing regions and think about what could be contributing factors to these differences. It follows that response to new technologies (for example, hybrids and fertilisers) will also differ across these regions.
Figure C2.19 uses two y-axes to present two sets of data as a function of time. The figure documents the yield (black lines), and the percentage of cotton farmland that had adopted Bt cotton across several cotton-growing states. Using two y-axes on the same graph allows the authors to superimpose two sets of data to see if there is any relationship between yield and percentage of Bt cotton area.

Figure C2.19 Cotton yield in kg/hectare and area under Bt cotton cultivation between 2000 and 2018 in three states: a. Gujarat. b. Punjab. c. Andhra Pradesh and Telangana.
Adapted from Kranthi, KR and Stone, GD, ‘Long-Term Impacts of Bt Cotton in India’, Nature Plants 6, no. 3 (2020): 188–196, doi: 10.1038/s41477-020-0615-5.
Gujarat
Figure C2.19a

Punjab
Figure C2.19b

Andhra Pradesh and Telangana
Figure C2.19c
- trend
- Pattern observed in descriptive, numerical or graphical data.
The data shown in Figure C2.19 do not show the same ‘clean’ trend that is observed in Figure C2.18. Can we conclude that Bt cotton has not impacted yield at all? Can we conclude that Bt cotton has negatively impacted yield?
The answer to both these questions is no! (Note: we can conclusively say that after 2006, almost 100% of the cotton-producing land in the three states was under Bt cotton cultivation.)
The only tentative conclusion we can draw is that other factors may also be influencing the yield of cotton. Such factors could include fertiliser use, pesticide use, increase in acreage of cotton plantations, or changes in technology, to name a few.
Kranthi and Stone also considered the changing nature of pest resistance and insecticide spraying as well as the changing dynamics of fertiliser use and technological advances in irrigation. These farming practices could significantly impact yield and farmer investment.
Indeed, Kranthi and Stone point out a few important facts that emerge from this data:
- Yields were increasing even before the introduction of Bt cotton between 2000 and 2003. In Gujarat, these increases could be attributed to improvements in irrigation facilities due to the Sardar Sarovar dam.
- Yields stagnated or even reduced within a few years of adopting Bt cotton.
- The introduction of Bt cotton certainly led to a decrease in the use of pesticides against Lepidopterans (see Figure C2.20). However, by 2009, spraying for sucking pests increased, and soon after, pink bollworm pesticide resistance began to spread. The data on expenditure on insecticides shown in Figure C2.20 support this claim.
- Fertiliser use correlates closely with yield, as shown in Figure C2.21.

Figure C2.20 Annual pesticide expenditure in US dollars per hectare for lepidopterans and sucking pests, 1999 to 2018.
Adapted from Kranthi, KR and Stone, GD, ‘Long-Term Impacts of Bt Cotton in India’, Nature Plants 6, no. 3 (2020): 188–196, doi: 10.1038/s41477-020-0615-5.

Figure C2.21 State-wide fertiliser use and Bt cotton yields between 2000 and 2015. a. Gujarat. b. Punjab c. Andhra Pradesh and Telangana.
Adapted from Kranthi, KR and Stone, GD, ‘Long-Term Impacts of Bt Cotton in India’, Nature Plants 6, no. 3 (2020): 188–196, doi: 10.1038/s41477-020-0615-5.
Gujarat
Figure C2.21a

Punjab
Figure C2.21b

Andhra Pradesh and Telangana
Figure C2.21c
These figures show that something else is going on apart from pest resistance that contributes to improved yield. Kranthi and Stone conclude that increased fertiliser use and irrigation has had a greater impact on improving cotton yields than Bt cotton.
Increased use of Bt seeds increased predation by non-lepidopteran pests. This, combined with rapidly spreading Bt resistance in the pink bollworm, led to increased expenditure on pesticides than before Bt seed adoption. Therefore, it seems that Bt cotton has made cotton farming capital intensive rather than providing any agronomic benefit.
- study design
- The methodology used to obtain and analyse data.
Many studies preceding Kranthi and Stone’s research had found that Bt cotton had benefited the economy and small-scale farmers.17 Each study uses (1) data derived from different sources, (2) collected over different periods of time, and (3) with varying study designs (that is, the different types of trials and experiments involving combinations of variables). These three factors can dramatically influence the conclusion of the study. Therefore, researchers need to carefully consider possible biases in order to reach an objective conclusion. Take a moment to revisit Table C2.2 on possible biases while designing studies.
Bt cotton is not the only Bt product in India. Other crops include Bt brinjal on which active trials are ongoing. If you had to design agricultural policies relating to the regulation of Bt cotton and other Bt products in the country, what action would you take? What factors would you take into account? We will leave this as an open question for you to think about, and independently form your opinion.
The point of changing pest resistance from lepidopteran to non-lepidopteran and the rise in pink bollworm resistance also highlights the fact that insect populations can adapt to changing conditions extremely rapidly, and there can be a switch in the pest population distributions. Changing this distribution may in turn influence organisms that predate on those pests and thus may lead to cumulative effects. Indeed, altering one component of any ecosystem can have long-term consequences over large spatial scales.
There may never be a final answer to the question of Bt cotton’s usefulness. A variety of factors influence Bt cotton yield, profit, and consequent environmental impact. These factors are dynamic, for example pest resistance may emerge, market demands may change, or technology may advance. It is difficult to come to a permanent conclusion about the usefulness of Bt cotton. Our answer may change as time passes and leads us to be cautious in our claims when adopting new technology.
Summary
In this section we learned how to evaluate a new technology and ask questions regarding its advantages and disadvantages. We saw, using the example of a recently published study, that we need to consider several aspects when evaluating the use of Bt cotton. We need to be very careful about off-target impacts in assessing a new technology.
Some impacts can be non-biological, such as farmers rapidly and illegally adopting Bt seeds for cultivation. Since no safety measures were taken while planting, this led to contamination of non-Bt plants with Bt genes via cross-fertilisation.
Another effect was that hybrid Bt seeds needed large inputs of fertiliser and pesticides for good yields. Such effects were not considered when the technology was approved. This means that the scientific validity of new technology is only one aspect to be considered when certifying it for public use.
C2.7 Quiz
Question C2.1 Choose the correct answer(s)
Cotton belongs to the _____ family whose flowers show the following characteristics:
- Asteraceae are characterised by composite flowers. Cotton has simple flowers.
- Cotton has large, solitary, showy flowers. It belongs to the family Malvaceae.
- Liliaceae have an inflorescence with flower parts in multiples of three. Cotton has solitary flowers with flower parts in multiples of five.
- Poaceae have an inflorescence and are wind–pollinated. Cotton has a simple flower that is insect–pollinated.
Question C2.2 Choose the correct answer(s)
Gossypium hirsutum, the dominant cotton species grown worldwide, has an allotetraploid genome. This means that the plant has:
- This is the normal condition for a diploid organism (2n).
- In some sense it has a double duplicated genome since there are four copies of each gene.
- This is partially true for tetraploid hybrids. There are 26 A chromosomes and 26 D chromosomes, each coming from the hybridisation event between the two Gossypium species.
- Although technically true, it is possible that all alleles have a function.
Question C2.3 Choose the correct answer(s)

Cotton yield in Maharashtra and All India from 2012 to 2018.
The bar graph shows cotton yield in kg/hectare for Maharashtra and All India over several years. Which of the sentences below describe the data accurately?
- There is an increase of 6% for the years shown.
- No statements can be made about use of Bt cotton and its contribution to yield.
- For the time period shown, the yield has fluctuated around an average of 525 kg/hectare.
- Maharashtra yields are less than the All India figures, so this statement is not true.
Question C2.4 Choose the correct answer(s)
The pink bollworm is extremely harmful to cotton plants because:
- Helicoverpa armigera (pink bollworm) is a moth in its adult stage which is not harmful to cotton plants.
- The caterpillar bores into the cotton boll at the first stage in its growth (instar) and feeds on the seeds as it grows, destroying the cotton boll.
- The caterpillar doesn’t feed on the roots.
- The insect is not known to be toxic to humans at any stage.
Question C2.5 Choose the correct answer(s)
The Agrobacterium tumefaciens Ti plasmid contains the following regions:
- The Ti plasmid doesn’t contain an antibiotic resistance gene.
- The Ti plasmid doesn’t contain an antibiotic resistance region.
- T-DNA region contains plant hormone genes; Virulence region contains genes responsible for excision, transfer and integration of T-DNA into the plant genome; Opine catabolism region contains genes for catabolism of opines, a class of amino acids that serve as a source of nitrogen and carbon for the bacterium.
- The T-DNA region is missing in this choice.
Question C2.6 Choose the correct answer(s)
If you want to introduce a new gene in a plant, inoculation with the Ti plasmid should be done in _________.
- It will be difficult to introduce the Ti plasmid into a seed, which is a well protected structure.
- A callus is plant tissue at a very early stage of growth, so inoculating with the Ti plasmid is easy to do under laboratory settings in a controlled fashion.
- Germ cells participate in fertilisation and are haploid. Their isolation is difficult and they will still need to be fertilised before they develop into a mature plant.
- You want transformation to appear in every cell of the plant, which will not happen in a mature plant.
Question C2.7 Choose the correct answer(s)
Plants are bagged during artificial hybridisation for the following reason:
- Self pollination could be a problem for bisexual flowers but usually self-pollination doesn’t occur in an open flower.
- Uncontrolled cross pollination will interfere with artificial hybridisation.
- Contamination with pollen from unselected flowers is a major problem in artificial hybridisation. Hybridised plants need to be protected so that there is no dilution of the desired traits by foreign pollen landing on the stigma of the female plant.
- No special conditions need to be maintained post hybridisation.
Question C2.8 Choose the correct answer(s)
You carry out an experiment with SV40 and λ DNA using EcoRI to produce cuts in the two DNA species. You then mix the two DNA species with DNA ligase to produce recombinant DNA. However, you find when you run a gel that λ DNA has not been incorporated into the SV40. Assuming you have followed the protocol, what could have happened to produce such a result?
- It is known that SV40 has a restriction site for EcoRI. That was the reason for Paul Berg and co-workers using EcoRI.
- λ DNA has a restriction site for EcoRI.
- DNA ligase can repair cuts made by EcoRI.
- We have to consider the possibility that SV40 can reseal without incorporating the λ DNA. Normally, we prevent this possibility by removing the phosphate group at the cut end.
Question C2.9 Choose the correct answer(s)
Gossypium arboreum and G. herbaceum fibres are not suited to making yarn because:
- The staple length is the deciding factor for processing cotton fibre into yarn. The long staple length of G. hirsutum is well suited for industrial ginning and spinning machines.
- The lint quality of both these species is excellent and fetches a premium in the market.
- The fibre diameter of all species is suitable for making yarn.
- G. arboreum and G. herbaceum grow naturally over large parts of India.
Question C2.10
The cotton fibre is a kind of ______ that is almost completely made of _______
- Germ cells would typically occur inside the seed.
- The cotton fibre could be thought of as a kind of trichome, but based on function it is classified as an epidermal cell (rather than a more specialised trichome).
- Epidermal cells in the seed wall extend to form the fibre. The cell wall synthesises cellulose during the secondary phase of cell wall growth.
- Sclerenchyma tissue is composed of cellulose and lignin but the cotton fibre isn’t part of this tissue.
C2.8 References
-
Preskar, P, ‘Mughal Empire Dominated the World’, Medium (3 September 2020), accessed 29 December 2020. ↩
-
Watt, G, The Wild and Cultivated Cotton Plants of the World: A Revision of the Genus Gossypium, Framed Primarily with the Object of Aiding Planters and Investigators Who May Contemplate the Systematic Improvement of the Cotton Staple (London: Longmans, Green, 1907) ↩
-
Prasad, S, ‘Suicide Deaths and Quality of Indian Cotton: Perspectives from History of Technology and the Khadi Movement’, Economic and Political Weekly 34, no. 5 (1999): 12–21, accessed 26 April 2020. ↩
-
Venugopalan, MV, Yadav, MS and Satish, V, ‘Institutional Structure of Cotton Research in India’, in Cotton Research, ed. IY Abdurakhmonov (London: InTech, 2016), doi: 10.5772/63798. ↩
-
Keller, EF, A Feeling for the Organism, 10th Anniversary Edition: The Life and Work of Barbara McClintock (New York: WH Freeman, 1984). ↩
-
Kranthi, KR and Stone, GD, ‘Long-Term Impacts of Bt Cotton in India’, Nature Plants 6, no. 3 (2020): 188–196, doi: 10.1038/s41477-020-0615-5. ↩ ↩2
-
Patel, C, ‘Evolution of Hybrid-4 Cotton’. Current Science 50, no. 8 (1981): 343–346, accessed 22 January 2021. ↩
-
Doak, CC, ‘A New Technique in Cotton Hybridizing: Suggested Changes in Existing Methods of Emasculating and Bagging Cotton Flowers’, Journal of Heredity 25, no. 5 (1934): 201–204, doi: 10.1093/oxfordjournals.jhered.a103922. ↩
-
Jackson, DA, Symons, RH and Berg, P, ‘Biochemical Method for Inserting New Genetic Information into DNA of Simian Virus 40: Circular SV40 DNA Molecules Containing Lambda Phage Genes and the Galactose Operon of Escherichia Coli’, Proceedings of the National Academy of Sciences 69, no. 10 (1972): 2904–2909, doi: 10.1073/pnas.69.10.2904. ↩
-
Cohen, SN, Chang, ACY, Boyer, HW and Helling, RB, ‘Construction of Biologically Functional Bacterial Plasmids In Vitro’, Proceedings of the National Academy of Sciences 70, no. 11 (1973): 3240–3244, doi: 10.1073/pnas.70.11.3240. ↩
-
Morrow, JF, Cohen, SN, Chang, AC, Boyer, HW, Goodman, HM and Helling, RB, ‘Replication and Transcription of Eukaryotic DNA in Escherichia Coli’, Proceedings of the National Academy of Sciences of the United States of America 71, no. 5 (1974): 1743–1747, doi: 10.1073/pnas.71.5.1743. ↩
-
Fry, JE, Hoffman, NL, Eichholtz, D, Rogers, SG and Fraley, RT, ‘A Simple and General Method for Transferring Genes into Plants’, Science 227, no. 4691 (1985): 1229–1231, doi: 10.1126/science.227.4691.1229. ↩
-
Gruère, G and Sengupta, D, ‘Bt Cotton and Farmer Suicides in India: An Evidence-Based Assessment’, The Journal of Development Studies 47, no. 2 (2011): 316–337, doi: 10.1080/00220388.2010.492863. ↩
-
Gutierrez, AP, Ponti, L, Herren, HR, Baumgärtner, J and Kenmore, PE, ‘Deconstructing Indian Cotton: Weather, Yields, and Suicides’, Environmental Sciences Europe 27, no. 1 (2015), doi: 10.1186/s12302-015-0043-8. ↩
-
Shiva, V, ‘Toxic Genes and Toxic Papers: IFPRI Covering up the Link between Bt Cotton and Farmers Suicides’, Research Foundation for Science, Technology and Ecology (20 December 2008). ↩
-
‘Central Institute for Cotton Research’, accessed 3 March 2021. ↩
-
Kathage, J and Qaim, M, ‘Economic Impacts and Impact Dynamics of Bt (Bacillus thuringiensis) Cotton in India’, Proceedings of the National Academy of Sciences 109, no. 29 (2012): 11652–11656, doi: 10.1073/pnas.1203647109. ↩
