A3 Urbanscapes
A3.1 Introduction
-
Capacities taught in this chapter
Scientific processHow do we study an urban ecosystem?
How do taxa adapt to urban environments?Scientific toolsGIS: How can simple tools be used for mapping land changes?Reading and interpretingIs the city an organism?Bridging science, society and the environmentCitizen science: how can citizen observations detect environmental changes?Quantitative skillsIs urban population growth the same everywhere?
- biota
- The plants and animals that live in a specific place, habitat, or time.
As students of biology it is difficult for us to think of a city as a biological landscape or an ecosystem. We associate ecosystems with regions that are considered more natural, such as mountains (Western Ghats chapter), forests (Figs chapter) or wetlands (Waterscapes chapter). However, ecosystems can also be defined as places where biota are concentrated and have many interactions. Cities with their dense concentration of humans and other biota certainly qualify on this count as ecosystems.
Urban areas assume importance when we consider the fact that over 55% of the human population now lives in urban areas, a number that will grow to 68% by 2050.1 This means that for the first time in human history, most humans live in a built environment rather than a natural one. This built environment is a unique landscape created by humans on the Earth’s surface, but one that harbours all the features of the ecosystems that we studied in the chapters on Western Ghats and Waterscapes.
This human-created landscape is especially present in India, as over 50% of India’s population will live in urban areas by 2030. India will also have seven megacities (population > 10 000 000) by the end of the decade.2 This point is highlighted in Figure A3.1a where we see urban population growth in Indian cities from 1950 to 2025.3
Study Figure A3.1a and follow the increase in the size of the red dots to see how our urban population has grown. Also follow the increase in the size of the pale red dots outside the Indian border and ask yourself whether we need to consider their growth when studying urbanization in South Asia. The satellite image of India at night from 2012 (Figure A3.1b) shows that it is possible to ‘trace’ the country using the brightness of artificial light as a proxy for urbanisation.
- social-ecological justice
- Social justice refers to the fair distribution of economic, political and environmental benefits, such as quality health services, the right to vote, or access to natural resources. Ecological justice refers to the protection of the ecosystem against the negative impacts of human activities. Together, this approach to justice recommends a fair participation in decision-making and a recognition of the ecological services provided by nature. See also: ecosystem services.
The projected urbanisation for India will constitute a huge shift in lifestyle for many people. If we are to create healthy and happy communities, we need to understand the urban landscape to plan for the accommodation of all these human beings. In the coming decade, people’s first and sustained experience of nature will be in an urban environment. How do we plan our cities so that humans develop a deep and lasting relationship with nature, a relationship that is built on principles of social and ecological justice? For this to happen it is important for humans to connect with and appreciate nature. As biologists we therefore need to understand how we can protect and increase natural spaces in cities to provide people with meaningful contact with the natural world.
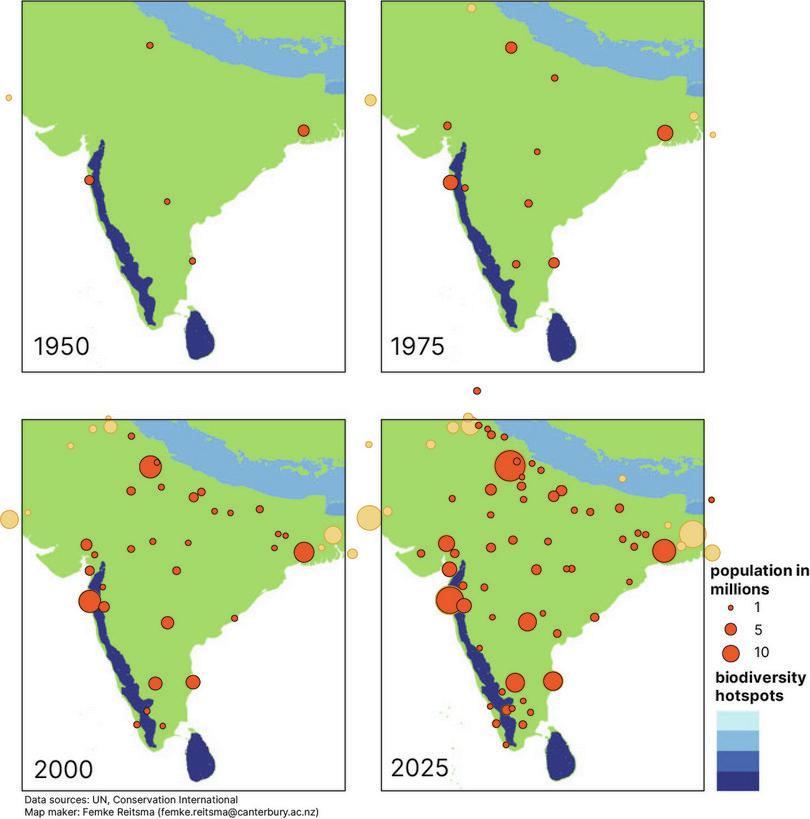
Figure A3.1a Urban population growth in India (red dots) 1950 to 2025.
With copyright permission from Femke Reitsma.
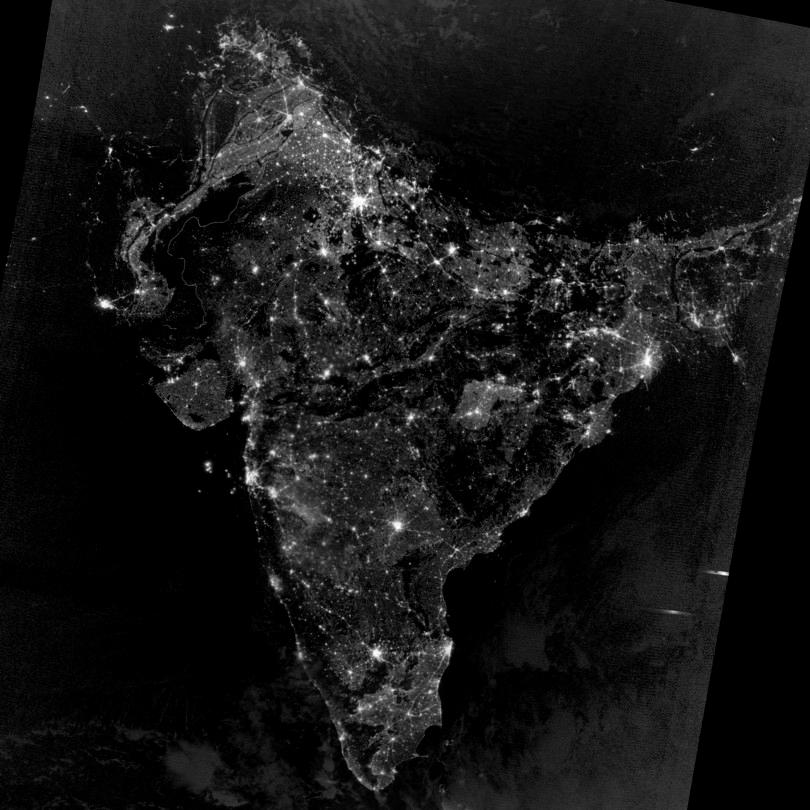
Figure A3.1b Satellite image of India at night (2012).
This chapter adopts multiple perspectives in examining a city. The first perspective is to consider a city to be an organism. Can the city really be understood as an organism, one that breathes, consumes and excretes? How can seeing the city as a living creature help us in understanding our interaction with it?
Another perspective is the one given by the field of urban ecology. Urban ecology considers cities to be valid field sites and studies ecological processes within them in much the same way as we would in more natural areas. Urban ecology straddles the disciplines of biology and geography, and each has its own way of understanding ecological concepts. While we do not explicitly speak about these differences, keep them in mind when you are reading this section.
Another aspect of cities is the tremendous landscape change caused by built-up areas, roads, and other infrastructure. What effects do these activities have on the natural world? Firstly, fragmentation of natural habitats into smaller and isolated pieces leads to loss of biodiversity. Secondly, human activities cause problems such as air, soil and water pollution, over-extraction of groundwater, and urban heat island effects. While there are technical and structural solutions to some of these problems (such as more efficient internal combustion engines or better public transport), many of them can only be implemented by protecting (and providing) natural habitats for plants and animals in urban areas.
Technological progress has fuelled the rapid pace of urbanisation globally. Satellite technology has helped us to map the Earth’s land and water surfaces in greater detail than ever before. This can be seen in Figure A3.2, where urban growth in Bengaluru city between 1990 and 2015 is shown dynamically by overlaying satellite images on a map of Bengaluru. This visualisation allows for an immediate understanding of the unprecedented pace of the city’s growth.
Figure A3.2 Urban growth in Bengaluru between 1990 and 2015. The grey regions at the centre are part of the original city. The red is the urban sprawl seen in all directions by 2015.
World Resources Institute (WRI) India, using EC-JRC and GHSL, India’s Environmental Challenges in 10 Images.
Satellite imagery has revolutionised the study of how land use has changed over several decades. This has become possible because longitudinal, high resolution data of much of the Earth’s surface is available.
The ability to understand data and use it for research and planning purposes has become increasingly important in ecology. Through the example of an urbanscape, we illustrate how geographic information systems (GIS) help ecologists. Over the last 30 years, GIS has influenced land use policy and it is now part of the standard toolkit of landscape biologists, urban planners, public health professionals, and so on. You can begin your GIS journey by doing Exercise A3.1.
- ecosystem services
- The benefits gained by human beings from the natural environment.
To highlight the importance of preserving nature, biologists have formulated the concept of ecosystem services. Ecosystem services try to determine the benefits that nature provides to humans. We know that plants, animals, fungi and microbes perform important services, such as providing cleaner air and water, and are vital to human health. We also derive tremendous cultural and spiritual benefits from nature.
This chapter introduces you to ecosystem services and uses a simple exercise to calculate the value of these services in an urban context. Through the concept of ecosystem services, we try to understand how biologists have framed the debate around conserving nature. As the world rapidly urbanises, such debates will become increasingly strident, and as students, we might have to come up with newer ideas to help people understand the value of nature better.
Finally, we study the impact of human activity in urban landscapes on other organisms. While cities are dominated by one species, namely Homo sapiens, we also share the space with thousands of other species, including trees, animals, fungi, and most importantly, soil protists and bacteria. How do these biota interact with a completely new environment, and does the built environment create challenges for these creatures?
Increasingly, biologists find that species living in such close proximity interact in interesting ways, making cities a completely new habitat that is worth studying. In many cases, plants and animals have shown interesting adaptations to survive (and in some cases thrive) in this landscape.4 Through this section we will begin our discovery of the non-human inhabitants that make up a city and find out how the urban landscape can affect a species.
A3.2 Urban ecosystems
Reading and interpreting Scientific process Scientific tools Quantitative skills
Nature in the city
India and Indians have a complex relationship with nature. We have a long tradition of reverence for nature, seen in our religious texts and hymns, and celebrated in festivals and songs. We all seem to love plants and animals, irrespective of our socioeconomic background. For instance, ecologist Harini Nagendra has documented gardens both in middle-class homes and in slum neighbourhoods of Bengaluru where people grow plants for a variety of reasons (aesthetic, cultural, or for sustenance).5 Urban Indians leave food outside temples and other places of worship for animals and birds, including ants, rats, dogs, pigeons and crows.

Simultaneously, this caring attitude sits comfortably alongside a curious indifference to the destruction of nature that we see in modern India. Since economic liberalisation in 1991, economic growth in India has led to rapid urbanisation. Cities have expanded outwards at an exponential pace. This urban sprawl has placed tremendous pressure on the villages and natural spaces surrounding cities because of land conversion, resource extraction and waste dumping.
In some cases, urban sprawl has extended into protected areas such as national parks, places that are meant to enjoy the highest protection of the law of the land. Urbanisation of rural and semi-rural areas has led to environmental pollution (such as chemical leachates in groundwater), biodiversity loss, and fragmentation of habitats. Further, within the core city areas, green space is diminishing as lakes, parks and other open spaces are converted to housing developments and built–up infrastructure. Study Figure A3.3 and think about how many of these scenes are familiar to you, where you live.
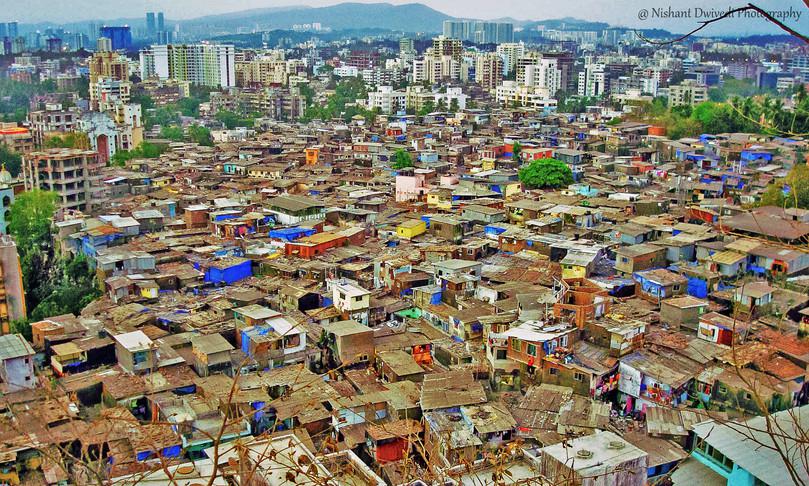
Scenes from different Indian cities.
Figure A3.3 Scenes from different Indian cities. Do you see any nature in these images?
a. Nishant D, from Wikimedia Commons, CC BY-SA 3.0.
b. Kaustubh Rau.
c. Nimish Subramaniam.
d. Indi Samarajiva, from Flickr, CC BY 2.0.
a. High rise apartments coexisting with informal settlements and green spaces in Mumbai
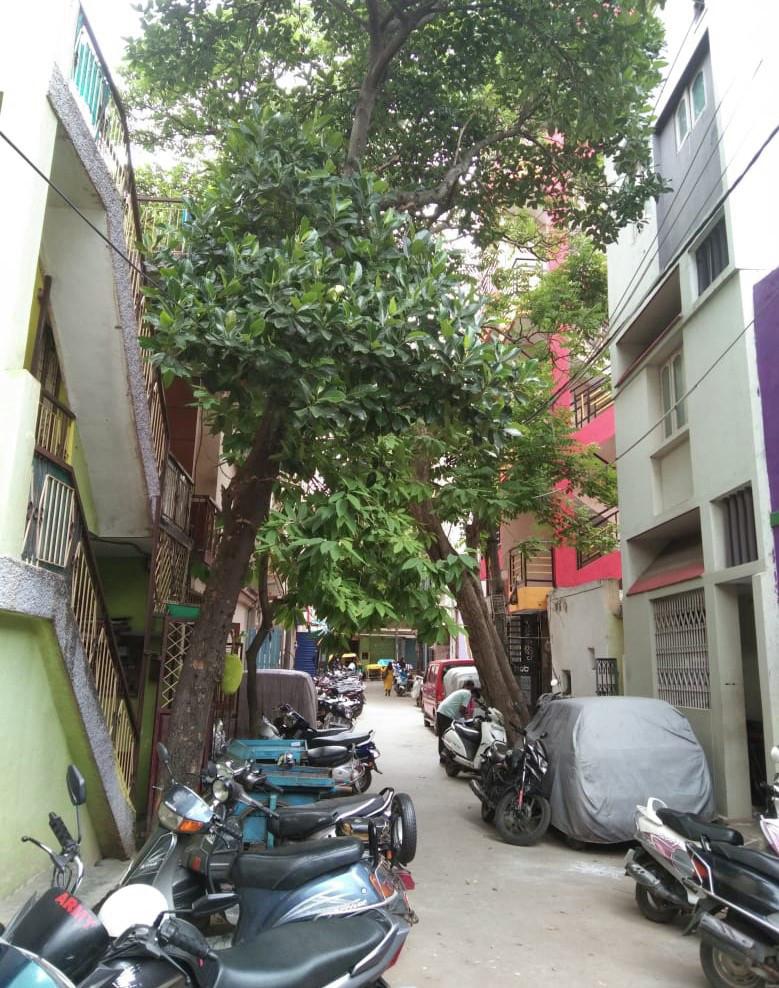
b. A street situated within an older neighbourhood in Bengaluru
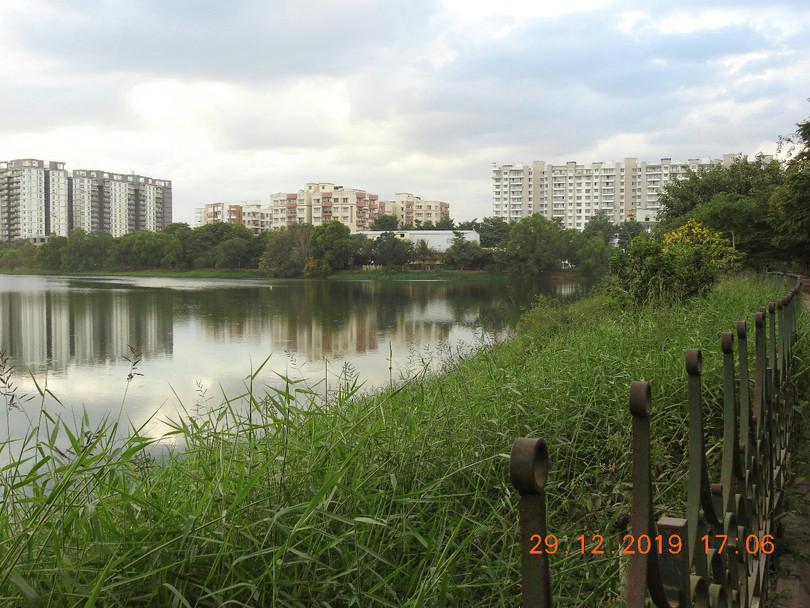
c. A lake in Bengaluru surrounded by high-rise apartments
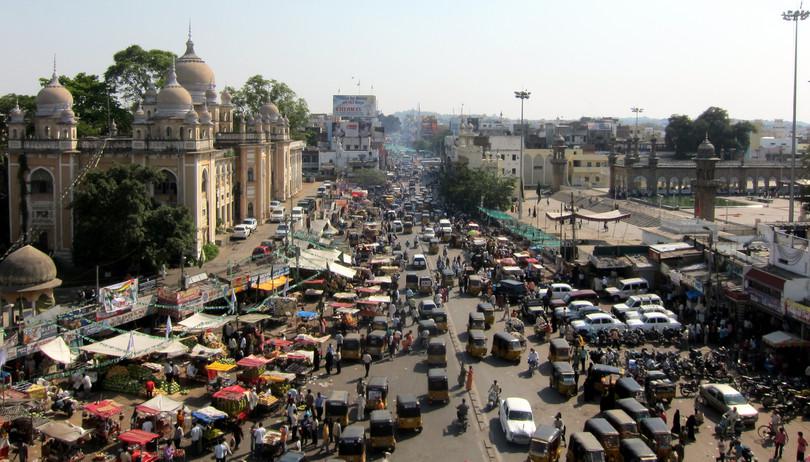
d. The view from Charminar in Hyderabad
- Global North
- The group of countries largely in the northern hemisphere of the globe that include the world’s richest and most industrialised societies. Continents such as Europe and North America are considered to be part of the Global North.
Due to the rapid pace of urbanisation, Indian cities have lost green space at an astonishing rate and now have lower levels of green space than their counterparts in the Global North. Figure A3.4 shows the amount of green space in terms of square metres per person in several Indian cities. The World Health Organization recommends a minimum of 9 m2 per person. Only Bhopal meets this requirement, with other cities falling far below the recommended area.6

Figure A3.4 Estimated per capita green space in square metres for Indian metros (2014).
Adapted from Tripathi, NG, and Bedi, P. ‘Digital Earth for Manipulating Urban Greens towards Achieving a Low Carbon Urban Society’, IOP Conference Series: Earth and Environmental Science 18, no. 1 (2014): 012157, doi: 10.1088/1755-1315/18/1/012157.
As India has urbanised and become more ‘modern’, its cities have lost natural spaces. Is there space in our cities for plants and animals, or should we only think about the human inhabitants and their needs? As biologists we need to apply our knowledge and skills to make cities liveable for all, humans and non-humans. In the following sections we will use two different ways to understand cities to see if these change our outlook.
Urban metabolism: the city as an organism
We tend to think of a city in terms of its physical infrastructure, such as concrete buildings, roads, and the electricity network. But are there ways to think about a city as a dynamic and functioning whole? For instance, could we think of a city as a cell, doing all the processes that a cell does to stay alive?
- urban metabolism
- A model used to analyse how resources are used and energy flows within an urban system like a city.
Thinking about a city as an organism has its roots amongst nineteenth century sociologists and biologists, starting with Karl Marx and Friedrich Engels.7 In its contemporary avatar, this concept is termed urban metabolism and is widely used by urban planners and environmentalists to understand and plan cities.
Urban metabolism tries to map the inputs and outputs of a city, treating it very much like an organism that eats, metabolises and excretes. Inputs into a city can include energy, food, and material goods, while outputs are wastes (solid, liquid and gaseous) and products that humans use.
The concept of urban metabolism enables us to think of what the city will need to sustain itself in a healthy manner. Figure A3.5a shows a simple diagram of urban metabolism for a city. Currently most cities follow a linear model with inflows of food, materials and energy, and outflows of waste and manufactured products.
- ecological footprint
- A method used to measure how much land and water area is required to fulfil our demand for consumption of resources and generation of waste.
We can also model a city on metabolic pathways that are circular, renewing and in some cases self-correcting. Circular pathways are less wasteful and reduce the city’s ecological footprint.
An example of using this framework is shown in Figure A3.5b for the city of Mumbai. Studying the figure, we see that water forms a major part of the inflow into the city. We notice that water output is 80% of water input.8 If we consider that all the water leaving the city is sewage (most of it untreated), then this brings new focus onto the problem of water usage and waste-water treatment. Releasing such large quantities of sewage into the creeks, estuaries and mangroves of Mumbai causes massive ecological damage. It is also a lost opportunity for the city to recycle its wastewater for internal use. Recycling sewage water would conserve natural water sources and place less strain on the water table.
1 PJ or petajoule = 1015 joule, which is equivalent to the energy released in a severe thunderstorm.
1 GJ or gigajoule = 109 joule
Mumbai’s energy consumption in 2013 was 272 PJ. Using a population estimate of 21 million in 2013, per capita energy consumption in Mumbai is 13 GJ. This is low by Global North standards, but typical for a country like India which is not (yet) highly industrialised.
Most of the energy used in Mumbai is electricity generated by coal-burning power stations, and fossil fuels that power industries and households. Transport also has a significant energy requirement. Carbon dioxide gas and particulate matter are the waste output of power stations, vehicles and biomass burning. Mumbai can reduce its current output of carbon dioxide emissions of 22 megatonnes (MT) by turning to renewable energy sources and increasing public transport. Reducing particulate matter will have significant public health benefits and improve the city’s metabolism. Examining a city’s demand on natural resources to provide water and energy encourages us to think of ways to reduce the demand.

Figure A3.5a Schematic of linear urban metabolism showing inputs and outputs.

Figure A3.5b Metabolic analysis of Mumbai.
Adapted from Reddy, BS, ‘Metabolism of Mumbai: Expectations, Impasse and the Need for a New Beginning’. Indira Gandhi Institute of Development Research, Mumbai (January 2013).
Exercise A3.1 is intended to guide you to think about a city as a living cell or organism. As you work through it, reflect on any changes in your perspective about your city (and neighbourhood).
Exercise A3.1 How is a city like an organism?
Scientific processReading and interpreting
- Use the table below to write down the characteristics of a city and a cell or organism. A few points are filled in to get you started. Can you think of more points of similarity than those given in the table?
Category Cell/organism City Form Defined form with growth in specific developmental stages. Form is controlled by DNA. Form is not defined and growth is unplanned.
(Exceptions are planned cities like Chandigarh.)
Do cities have units like cells in an organism?Inputs Energy Autotrophs trap energy from the sun in photosynthesis. Heterotrophs obtain energy by eating or decomposing other organisms. Water Natural sources of water such as rivers, lakes and rainfall are used for habitat and body requirements. Materials Animals need materials for housing. They use locally available resources for this purpose. Plants require soil for anchoring and nutrients. What materials does a city require? Where are they sourced from? Outputs Waste (organic and inorganic) Regulation Homeostasis: temperature and metabolic balance (fluids, pH, blood pressure, and so on) are maintained. Similarities and differences between a city and a living organism
- Consider your surroundings, which can be your home, apartment complex or the neighbourhood in which you live. Determine the inflows and outflows of your locality. How does energy come into the system and flow out of it? What is the waste emissions profile of the system?
- How is a city NOT like an organism or cell?
City as an ecosystem
- energy flow
- The flow of energy through the various components of a system.
- nutrient cycling
- The flow of nutrients between the biotic and abiotic components of an ecosystem; nutrients are taken from the environment and pass through living organisms, only to be released eventually back into the environment.
The second way to think about a city is as an ecosystem. While the concept of an ecosystem applied to a city seems paradoxical, cities possess all the factors that define an ecosystem. We typically describe an ecosystem using three aspects: abiotic and biotic components, energy flow and nutrient cycling. More recently, socioeconomic aspects have also been included in the analysis of an ecosystem. Socioeconomic factors are particularly important in an urban context.
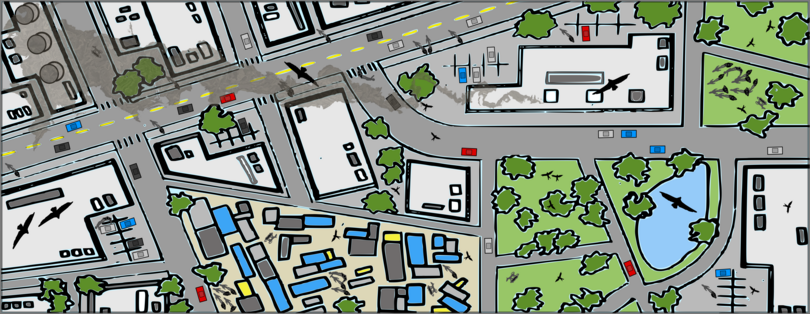
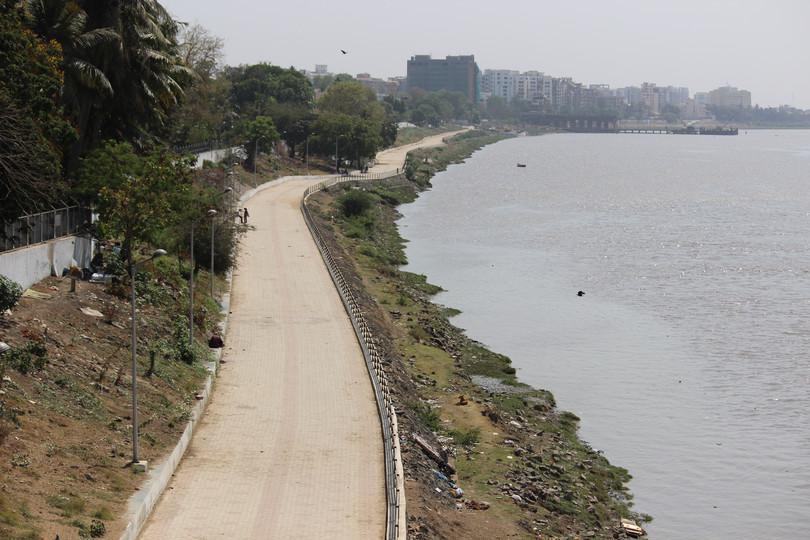
Figure A3.6 shows a large, urbanised area with a variety of housing (apartments and slums) with natural elements like green spaces and water bodies. How can we use the concepts of a generalised ecosystem to understand an urban ecosystem?

Figure A3.6 An urban ecosystem in India.
Extra reading Components of an urban ecosystem
- Abiotic components:
- Temperature, rain, wind, light, soil, minerals, topography.
- Artificial light, sound (noise) and air quality are important abiotic factors in a city.
- Built-up areas and paved surfaces define the topography of a city.
- Soils and topography are important when planning new settlements.
- Biotic components:
- Producers: green plants that are hardy (many exotic species) and can survive in urban settings, along with human-created green spaces that can have native and exotic species; human beings also provide food as waste to sustain many non-human inhabitants in the ecosystem, so could be termed producers.
- Consumers: humans and other animals such as rodents, feral cats, dogs, birds and insects; all are more generalists than specialists.
- Decomposers: bacteria, fungi and protozoans break down waste food and sewage; feral birds and animals scavenge waste in Indian cities and contribute to the breakdown of waste.
- Energy flow: how does energy flow through different trophic levels?
- Normally there are three to four trophic levels with the sun as the primary energy source. All species are interconnected, so it is better to think of this as a web.
- A city can have similar trophic levels, but humans are at the top of the pyramid. Humans artificially sustain certain species, such as plants in parks and gardens, birds, dogs and rodents.
- Energy sources other than the sun are available, including electricity, natural gas and fuel for motor vehicles, all dependent on fossil fuels.
- Nutrient cycles: movement and exchange of organic and inorganic matter:
- There are several nutrient cycles such as water, carbon, nitrogen and phosphorus. Nutrients flow into and out of the system and are renewed periodically. All cycles are balanced in a properly working ecosystem.
- These cycles can be out of balance due to human activity, for example, sewage that flows into rivers and lakes can cause severe damage to these water bodies, leading to algal blooms and fish kill. Industrial and vehicular emissions affect the carbon and nitrogen cycle.
- Sewage treatment works help to break down human waste and recycle water and nutrients.
- Socioeconomic context:
- Natural ecosystem: villages depend on the natural ecosystem for several resources, including extracting timber, minor forest produce, and grazing, ideally without affecting it.
- Urban: complex interactions between government, industry and civil society that decide how the ecosystem develops. Currently economic growth and migration patterns are major drivers of India’s cities.
Case study: Analysing the city of Surat as an urban ecosystem
Using the components of an ecosystem described in the extra reading as a guide, we will study the city of Surat as an urban ecosystem in India. Surat is India’s eighth largest city and is going through a tremendous expansion phase. By one account, it will be the fastest growing city in the world between 2019 and 2035.9 It is also one of the cities in the Government of India’s Smart Cities programme. These developments make it an interesting example for us to use in understanding urban ecosystems.
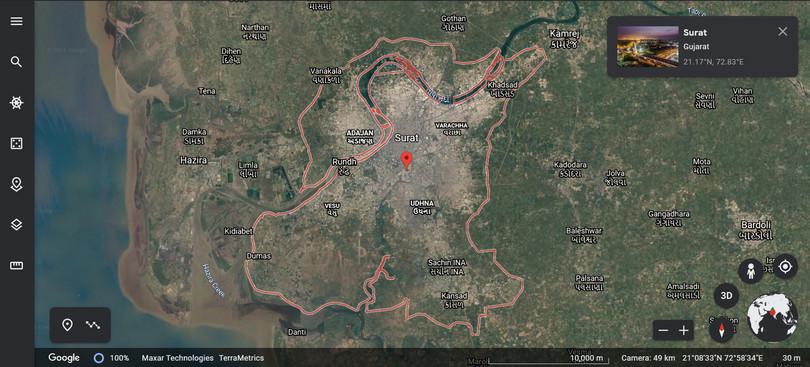
A bend in the river: different views of Surat city as an urban ecosystem.
Figure A3.7 A bend in the river: different views of Surat city as an urban ecosystem.
a. Google Maps, 2021.
b. Rahul Bhadane, Wikimedia commons, CC-BY-SA 4.0.
c. Rahul Bhadane, Wikimedia commons, CC-BY-SA 4.0 .
a. A satellite image of Surat city in which the outline represents the limits of the city
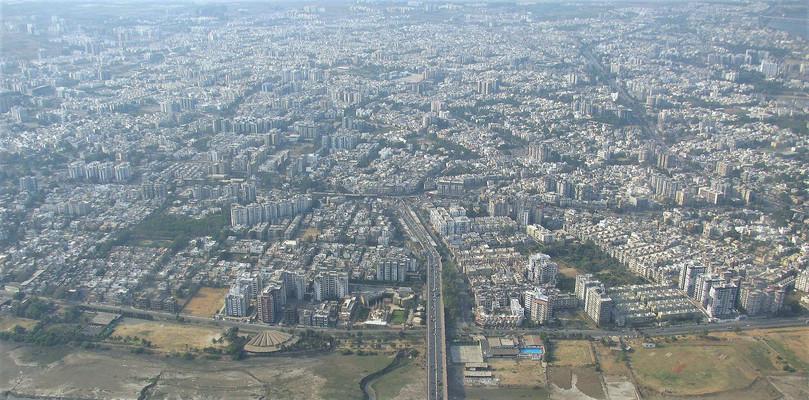
b. An aerial view of Surat showing dense urbanisation near the Tapi river
c. Tapi river front under construction
Table A3.1 is a datasheet for the city of Surat. Using the same categories in this table, we will see how the city is performing as an ecosystem.
- estuary
- The region where fresh water from rivers and streams meets the salt water from the ocean.
- catchment area
- The area from which rainfall drains into a river.
| Component | Remarks |
|---|---|
| Abiotic: Temperature range (average): 22–33°C with >300 days of sunlight. Yearly rainfall (average): 1202.8 mm. Average humidity: 60% (range 41–85%). Topography: Surat has a flat landscape with an average elevation of 13 metres (so it is almost at sea level). The floodplains of the Tapi meet the coastal plains near the sea. Soils: Substratum of basaltic lava flows covered with black loamy to clayey soils. Surat district is at the north-western edge of the Deccan plateau, which explains the basalt layer. |
Surat lies on the banks of the Tapi river. The river fans out into a delta with mangroves where it meets the Arabian Sea. This estuary (river-delta) is an important component of the urban ecosystem. In 2006, Surat suffered a severe flood with 80% of the city being under water. This was the third major flood since 1994, caused by release of waters from the Ukai dam on the Tapi river, 100 km upstream of the city. Urbanisation and a reduction in the catchment area are partly responsible for the floods. The city has instituted disaster management plans and a flood control network to account for future extreme weather events. |
| Biotic: Human population 4.46 million (2011 census). Within the city limits the fauna is typical of urban areas. The river and estuary harbour many aquatic and amphibian species. Flora is primarily planted by humans and is a mix of native and exotic species. A 2013 Gujarat Forest Department study recorded low tree density (8.6 per hectare) in Surat city. A 2014 study recorded that space for gardens and recreational areas is 3% (2.34 km2) of the total urbanised area. The green space per capita value for Surat is 0.5 m2 (Figure A3.4). |
The human population increased by 63% between the 2001 and 2011 censuses. (Estimated population in 2021 is 7.5 million.) A 68 hectare Biodiversity Park is being constructed on both banks of the Tapi river. This is meant to target areas used for illegal garbage dumping, sewage outflows and unplanned construction. |
| Energy flow: Terrestrial and aquatic food webs. Human activity drives both these trophic webs with sewage and garbage being major contributors. Loss of vegetation leads to reduction in primary productivity. |
The riverine environment harbours many aquatic species and threatened bird species such as the lesser flamingo (Phoeniconaias minor). |
| Nutrient cycling: Carbon: Perturbations due to human activities, mainly from fossil fuel emissions. Nitrogen and phosphorus cycle: Not enough information. Water cycle: While water table levels are high (availability at 5–10 m) over-extraction has seen ingress of saline water into wells. |
The city government has calculated per capita carbon emissions at 4.46 tonnes. This value is lower than other Indian cities but far higher than the all-India value of ~2 tonnes. The city has a bus rapid transit system to reduce transport-associated carbon emissions. Human activity (waste dumping, sewage flow and over-extraction) are all affecting the water cycle. There are plans to convert 80% of biodegradable waste into compost. |
| Socioeconomic context: Hub for diamond processing, textiles and industries. The city is part of the Vapi-Ankleshwar industrial belt. Hazira liquified natural gas (LNG) port is nearby. |
Migration for jobs is a major cause of population growth. Surat is expected to grow at 9.5% per year and will continue to urbanise rapidly. |
Table A3.1 Surat city urban ecosystem datasheet.
Table A3.1 reveals several interesting features about Surat. It is clear that the Tapi river and its associated estuary are a dominant feature of the landscape and the city has grown around the river. Tidal inflows influence the river for several kilometres upstream to form a brackish water delta which has unique flora and fauna typical of mangrove forests. During winter months, many migratory birds visit the estuary and the city to feed on the diatoms, copepods and crustaceans that thrive in the brackish water.
Water flow depends on the Ukai dam 100 km upstream of the city. As with many rivers surrounded by urban settlements, the Tapi suffers from sewage inflow and garbage dumping, affecting aquatic and human life. The city government has reduced sewage flow by constructing a citywide sewage system with treatment plants.
A 68 hectare Biodiversity Park is under construction on the river banks to rejuvenate biodiversity. However, the projected population growth means that urbanisation will continue for the near future. It is not clear how this urbanisation is to be balanced with protecting the fragile estuary and river system, increasing biodiversity, and reducing environmental pollution.
- land use/land cover
- Land use is the purpose for which land is being used, such as agriculture. Land cover is the surface cover on the ground, such as urban infrastructure or bare soil. When used together, this term indicates the categorisation of both human activities and natural processes within a particular time frame.
Table A3.2 shows the changes to land use/land cover characteristics of Surat between 1998 and 2016.10 The city has used open land for urban growth.
Vegetation has reduced, a trend that has accelerated in the last decade. As with many cities in India, there is a dearth of basic data to make clearer projections and recommendations. It is possible to generate data through environmental surveys of flora, fauna, soil and water, and as biology students, these are clear ways for us to be involved in deciding the city’s future.
The category ‘bare soil’ in Table A3.2 is a misnomer, since these are open spaces with ground cover and scrub vegetation that harbour biodiversity and serve as groundwater recharge areas.
| Land use/land cover type | % change between 1998 and 2016 |
|---|---|
| Water bodies | −9.4 |
| Vegetation | −6.0 |
| Built-up | 46 |
| Bare soil | −44 |
Table A3.2 Land use/land cover change between 1998 and 2016 in Surat City.
Mukherjee, F and Singh, D, ‘Assessing Land Use-Land Cover Change and its Impact on Land Surface Temperature Using LANDSAT Data: A Comparison of Two Urban Areas in India’, Earth Systems and Environment 4, no. 2 (2020): 385–407, doi: 10.1007/s41748-020-00155-9.
The case study of Surat provides us with a way to analyse urban spaces through an ecosystem framework. What have we learned by examining the case study?
The city has to balance the competing demands of preserving the riverine ecosystem and the economic impetus that drives the human inhabitants. A healthy ecosystem is intricately linked with human health and wellbeing, so ultimately it is to our benefit to preserve and protect nature. The effect of ecosystem degradation can be asymmetric, depending upon your socioeconomic status. Very often the communities most affected by degradation are those that are economically and socially most vulnerable. Can you do a similar analysis for your city or neighbourhood? To research different aspects of your ecosystem you can combine your personal observations with reliable information retrieved from the Internet, as shown in the chapter on Waterscapes.
Land use change
Land use change is the process by which human activities transform the natural landscape.11 Dramatic land use change has been a defining feature of Indian cities in recent years. Fuelled by economic growth, cities have expanded rapidly, adding new housing developments, industrial hubs and roads. Natural ecosystems have rapidly degraded as cities have expanded outwards. Green spaces have become fragmented, leading to loss of biodiversity.
Land use changes also perturb nutrient cycles, for instance, urbanisation affects the carbon and nitrogen cycle through industrial and vehicular emissions and loss of topsoil. Therefore, it is important to map and understand land use changes for making decisions about cities.
Figure A3.8 shows land use changes for the National Capital Territory of Delhi.12 We see an increase in built-up land with the city expanding in all directions (note especially urbanisation in the north-west and south-west parts of the National Capital Territory). We see an accompanying decrease in ‘fallow’ land. Fallow land is arable land that is not being used for growing crops. It often harbours tremendous biodiversity. Typically, urban planning bodies and municipalities see fallow land as places for expansion, when in fact they need to be preserved for their inherent biological or agricultural value.

Figure A3.8 Changes to the land use patterns of the National Capital Territory of Delhi between 2001 and 2017. Follow the red to see the increase in built-up areas.
Adapted from Pramanik, S and Punia, M. ‘Land Use/Land Cover Change and Surface Urban Heat Island Intensity: Source–Sink Landscape-Based Study in Delhi, India’. Environment, Development and Sustainability 22, no. 8 (2020): 7331–7356, doi: 10.1007/s10668-019-00515-0.
Geographic information systems (GIS) activity
How do we find out data such as those shown in Figure A3.2 and Figure A3.8? Is it possible for students to generate such data?
The answer is yes. Remote sensing using satellites has revolutionised mapping across the Earth. Access to public image databases allows us to map land use changes on our computers. We can generate maps that help us understand ecosystem changes and provide enhanced data to city planners, environmentalists, and civil society to make better land use decisions.
Most Indian cities lack such maps at a neighbourhood scale, and with land parcels being ill-defined, open spaces can easily be converted into built-up areas. Using simple tools like Google Earth and ImageJ, students can generate maps of their neighbourhoods that will help concerned citizens, architects, town planners, and city commissioners. Let us do a simple exercise that will allow us to generate such maps. Although we have chosen a simple exercise, it is possible to add layers of complexity to land use maps and examine different categories of land use.
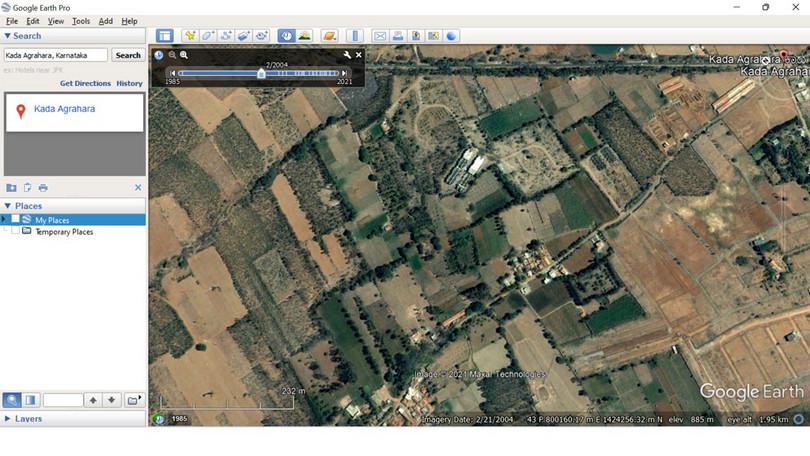
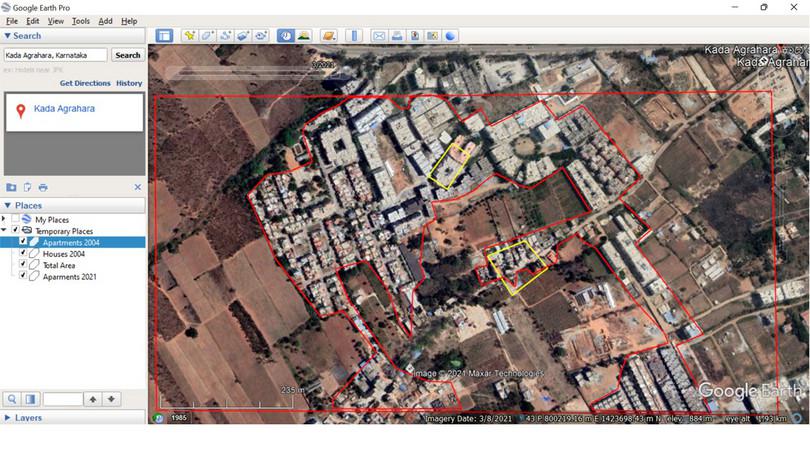
Exercise A3.2 Identifying Land Use Change using Google Earth
Scientific processQuantitative skillsDownload Google Earth Pro.
![Searching Google Earth for a particular location.
: Screenshots of the steps taken to open Google Earth and search a specific location.]()
Searching Google Earth for a particular location.
Exercise A3.2 Searching Google Earth for a particular location.
Ayushi Biswas
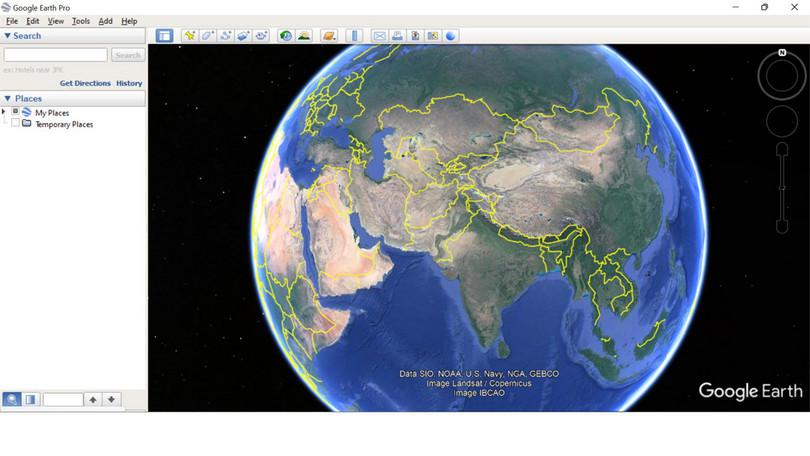
![Opening Google Earth.
: A screenshot showing the Google Earth application open on a device.]()
Opening Google Earth.
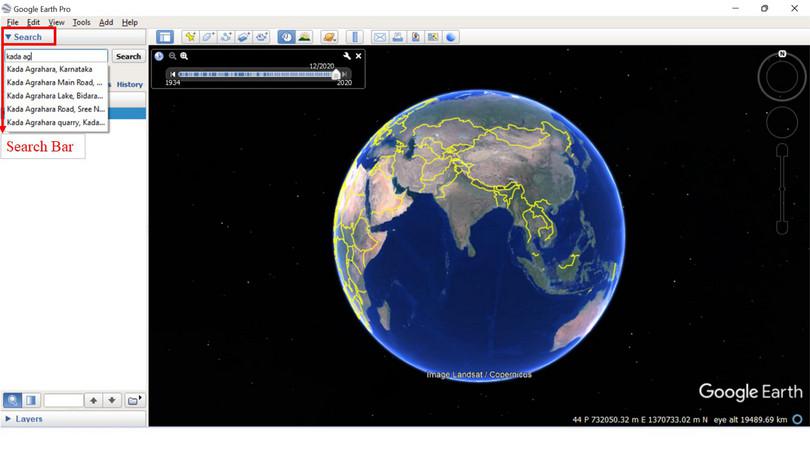
![Searching for a specific location.
: A screenshot showing the use of the search bar on the Google Earth application.]()
Searching for a specific location.
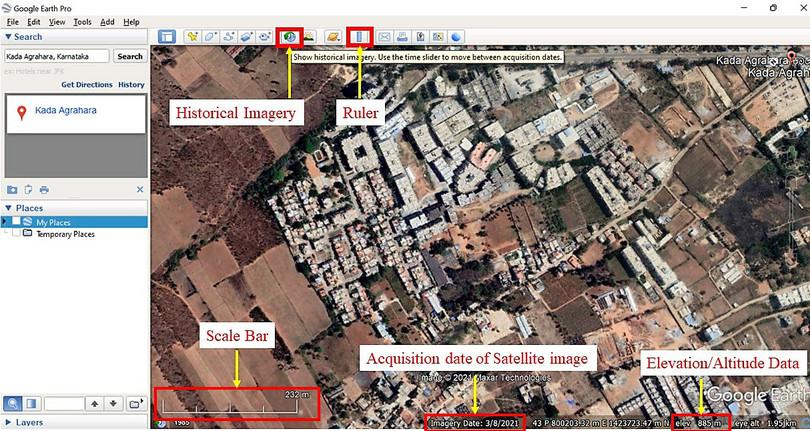
![Properties displayed along with the image.
: A screenshot highlighting the different buttons on Google Earth and their functions.]()
Properties displayed along with the image.
![A historical image from 2004.
: A screenshot showing the use of the cursor element on Google Earth which allows the user to select the year of their requirement.]()
A historical image from 2004.
![Using the ruler icon to open the measurement toolbox.
: A screenshot showing the use of the measurement toolbox on Google Earth.]()
Using the ruler icon to open the measurement toolbox.
![Choosing the polygon icon and selecting an area of your interest.
: A screenshot showing the use of the measurement toolbox on Google Earth, to draw polygons on the map.]()
Choosing the polygon icon and selecting an area of your interest.
![Assigning a name to the saved area (polygon).
: A screenshot showing the use of the measurement toolbox on Google Earth to name the area on the map selected by the polygon.]()
Assigning a name to the saved area (polygon).
![The area (in sq. metres) of the polygon can be seen in the measurement tab.
: A screenshot showing the use of the measurement toolbox on Google Earth. The measurement is visible in the measurement tab.]()
The area (in sq. metres) of the polygon can be seen in the measurement tab.
![Choosing a different polygon and measuring its area.
: A screenshot showing the use of a diffeernt type of polygon to select and measure a new area on the map.]()
Choosing a different polygon and measuring its area.
![Choosing a different year for analysis (in this case, 2021).
: A screenshot showing the use of the cursor to select another year for analysis. The year 2021 has been selected.]()
Choosing a different year for analysis (in this case, 2021).
![Polygons marking human settlements for 2021.
: A screenshot showing a polygon marking the human settlements within the second polygon that had been drawn.]()
Polygons marking human settlements for 2021.
![Overlaying areas from two different years.
: A screenshot showing overlayed areas from two different years, differentiated by using the colour yellow and red.]()
Overlaying areas from two different years.
- Open Google Earth and search for the location (see the box outlined in red).
- After choosing a location, find the view of the same image at different time scales using the ‘Show Historical Imagery’ option in the toolbar. We have chosen Kada Agrahara, a village in Karnataka.
- Slide the cursor to the required year, avoiding any image with cloud cover or blurry images (we have chosen an image from 2004).
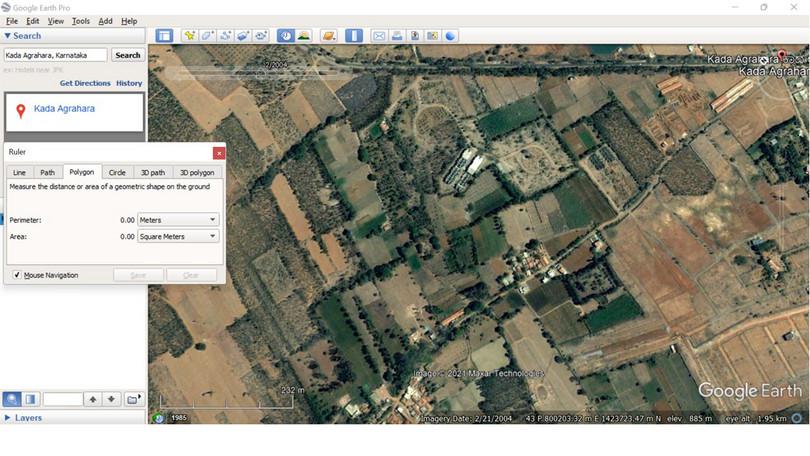
- Click the ruler icon and go to the polygon option.
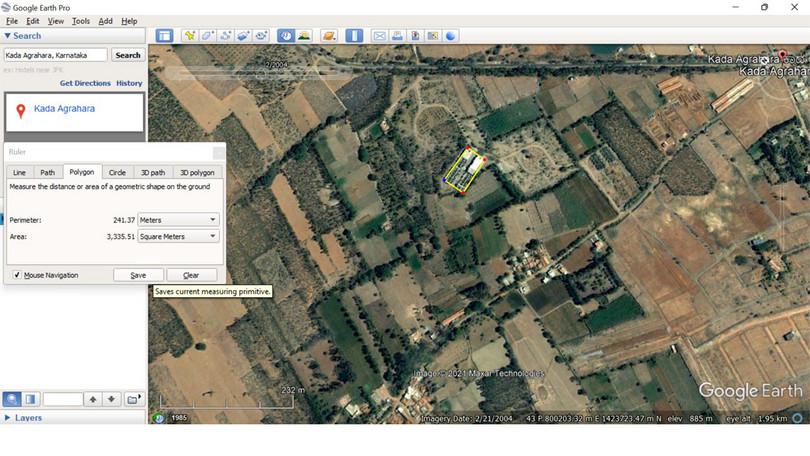
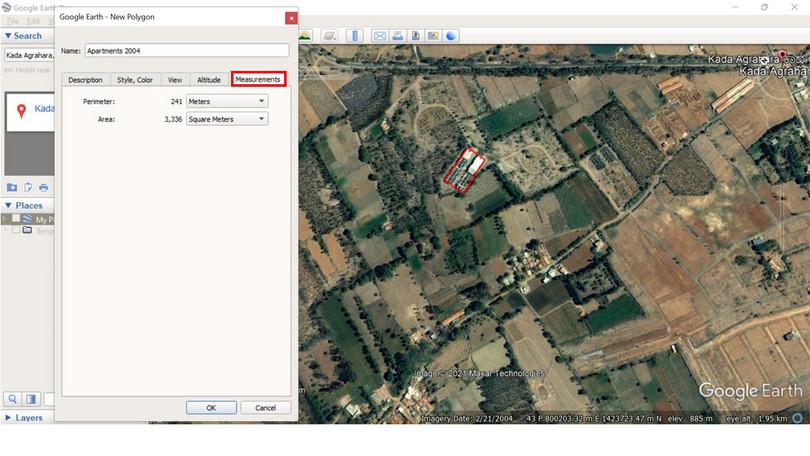
- Use the polygon tool to mark out an area of interest. In the image we have chosen to demarcate a human settlement. Note the area value given by the ruler for the demarcated region and save the polygon.
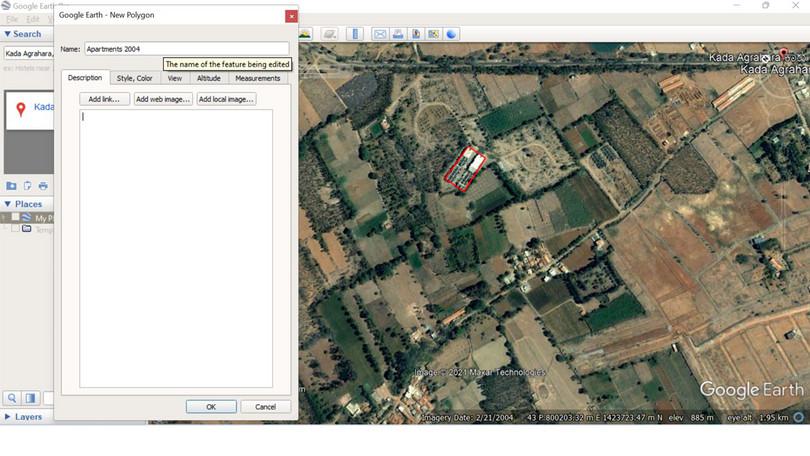
- Save the polygon and give it a name that will describe the demarcated area.
- Note down the area shown in the measurement tab. The units for area can be chosen in the dropdown menu.
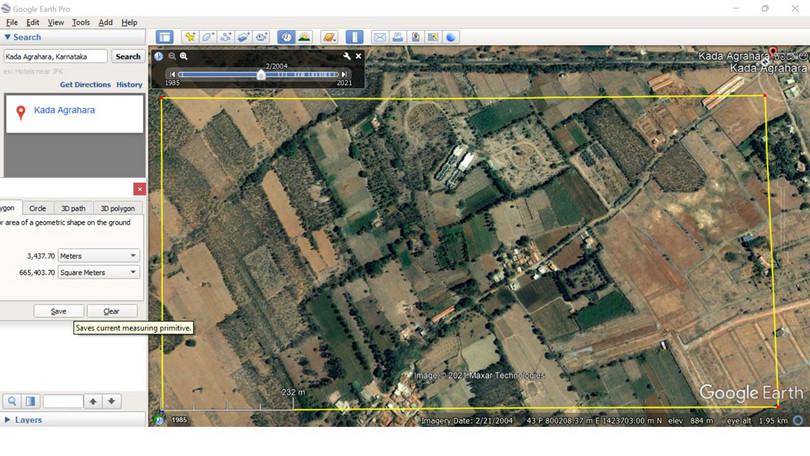
- Similarly, using the ruler and polygon option a different area can be measured. (In the image a much larger area has been chosen to be measured).
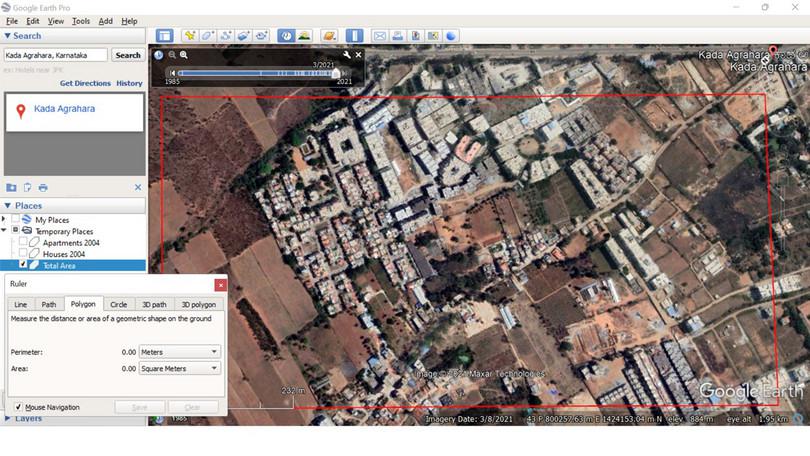
- Choose an image from a different year and repeat steps 5 and 6. In the example we have chosen the year 2021.
- Calculate the area of the new polygon and note it down. Using the values for 2004 and 2021 we can calculate the change in a particular land use type. In the example we have chosen human settlements, but it could also be possible to look at changes to agricultural land, forest land and water bodies.
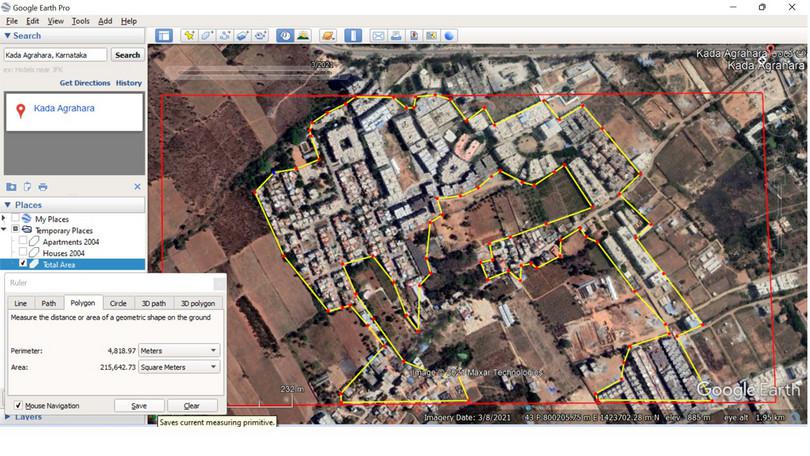
- It is possible to overlay previously saved polygons for the same image series.
- Total area, and area for human settlements for the years 2004 and 2021 can be obtained from the Polygon properties in Measurements option. The percentage change can then be calculated.
Ecosystem services
Why do you think we emphasised the role of nature in the city in the previous two sections? One could argue that cities should be for humans, and areas outside cities should be for all the non-human inhabitants of the planet.
One line of thought argues that urbanisation is good for the planet. With a dense concentration of settlements, there is greater efficiency in delivery of materials and services, leaving larger undeveloped areas of natural vegetation and wildlife. Wouldn’t that work in the interest of both humans and non-humans?
One reason that it doesn’t work is because urbanisation takes over spaces that were previously other kinds of natural ecosystems such as forests or grasslands. Urban development displaces the original inhabitants of that ecosystem. For example, Mumbai is built on what were originally marshes. Some aspects of the original ecosystem are incorporated into the city, for example Mumbai retains remnants of the original marshes and mangroves along its coastline. If we value the lives of other species, then we need to preserve as much of their original habitat as still exists.
A second reason is that nature is beneficial to the wellbeing of humans. Urban areas need a significant amount of nature within their boundaries for a healthy, functioning society. Think of nature as an environmental service provider that is necessary for human existence.
The concept of nature as an environmental service provider was formulated and discussed by several biologists from the 1970s onwards. Ecologist Gretchen Daily and her colleagues gave it the name ‘ecosystem services’.13 The rationale was that attaching monetary values to all the services that nature provides to humans enables activists to convince decision makers to preserve nature. Arguments about the intrinsic value of nature (conservation for its own sake) or the ethics of preserving all life on Earth (all species have an equal right to live) have been less successful.
Ecosystem services are now defined as products or processes of natural systems that directly or indirectly benefit humans or enhance social welfare. Examples include erosion control provided by trees and grasses whose roots hold the soil, temperature regulation by forests, and pollination services by bees and other insects.

Figure A3.9 Categories of ecosystem services as formulated by the Millenium Ecosystem Assessment, 2005.
Millennium ecosystem assessment, Ecosystems and human well-being: Synthesis (Washington, DC: Island Press, 2005) and TEEB Manual for Cities: Ecosystem Services in Urban Management, The Economics of Ecosystems and Biodiversity (2011), accessed 3 November 2021.
There are four categories of ecosystem services:
- primary productivity
- The rate at which organic compounds are produced from the conversion of environmental energy.
- Provisioning: material goods obtained from nature that are necessary for human survival. Examples are food, water, wood, fibre and medicines.
- Regulating: regulation of processes, such as climate and water purification. Examples are pest control by birds, flood control by forests, and water purification by reed beds in wetlands.
- Cultural: non-material benefits of ecosystems such as educational, heritage and spiritual benefits from sacred groves and recreational gardens, for example.
- Supporting: processes on a regional to global scale such as soil formation, biodiversity maintenance, nutrient cycling, and primary productivity.
How does one go about assessing ecosystem services in urban areas? We will do an exercise using a recent study from West Bengal.14 The authors, Das and Das, studied the impacts of urbanisation on ecosystem services through land use/land cover (LULC) changes for Old Malda. Old Malda is a small town located about 300 km north of Kolkata, near the Bangladesh border. Satellite data from four years (1990, 2000, 2010 and 2017) spanning 27 years was used. Attempt the exercise that follows to calculate the ecosystem services value for Old Malda in this period.
Exercise A3.3 Ecosystem services
Scientific processQuantitative skillsThe authors used the following steps to calculate the ecosystem services value for Old Malda.
Step 1: Based on satellite imagery, define land cover types under four categories.
Land cover types Description Equivalent biomes Value coefficient (million US$ ha−1 yr−1) Built-up Areas with houses and other buildings Urban 0 Agricultural land Areas with crop production Crop land 92 Vegetation Green space Forest 969 Water body Blue space: open water Rivers, lakes, ponds 8498 Calculating ecosystem services values for Old Malda.
Das, M and Das, A, ‘Dynamics of Urbanization and its Impact on Urban Ecosystem Services (UESs): A Study of a Medium Size Town of West Bengal, Eastern India’, Journal of Urban Management 8, no. 3 (2019): 420–434, doi: 10.1016/j.jum.2019.03.002.
The value coefficient (VC) signifies the monetary value provided by the particular land cover type. The value has been assigned based on earlier studies. Therefore, agricultural land provides goods and services that are equivalent to 92 million US dollars per hectare per year. Note the high VC of forests and water bodies (green and blue spaces).
Step 2: Estimate the ecosystem services value (ESV) by calculating the area (A) of each land type and multiplying it by the value coefficient.
\[\text{ESV}_{\text{water body}} = \text{A}_{\text{water body}} \times \text{VC}_{\text{water body}}\] \[\text{ESV}_{\text{total}} = \text{ESV}_{\text{built-up}} + \text{ESV}_{\text{agricultural}} + \text{ESV}_{\text{vegetation}} + \text{ESV}_{\text{water body}}\]
- The area of each land cover type is estimated from the satellite data. The GIS activity that you did earlier can be used for estimating the area of each land cover type.
- Sum all the ESV values to get the total value of ecosystem services.
- Use the equation to calculate the ESV for each land cover type and calculate the total ESV for 1990 and 2017, using the table below.
Land cover types Area (hectare) 1990 Ecosystem services value (USD) Area (hectare) 2017 Ecosystem services value (USD) Built-up 212 313 Agricultural land 315 235 Vegetation 309 214 Water body 119 194 Total Calculating changes to ecosystem services for Old Malda for 1990 and 2017.
Das, M and Das, A, ‘Dynamics of Urbanization and its Impact on Urban Ecosystem Services (UESs): A Study of a Medium Size Town of West Bengal, Eastern India’, Journal of Urban Management 8, no. 3 (2019): 420–434, doi: 10.1016/j.jum.2019.03.002.
Exercise A3.3 shows that it is possible to calculate ecosystem services value for any ecosystem if we have access to data. Das and Das used several checks to ensure that their calculations and interpretations were correct. These were:
- Calculate the Kappa coefficient (K) to determine the level of agreement between the image data and field reality. This needs a reference data set for which you know the land cover type. The K value ranges between 0 and 1, with a value >0.85 indicating strong agreement between the two data sets.
- Based on statistical analysis, the authors confirmed that using the value coefficient calculated for a global biome was valid for land cover types in Old Malda, since they weren’t exact matches (for example, the forest biome value was used for all land classified as vegetation, although it may not necessarily be forest).
- It is possible to calculate the ESV for each ecosystem service category (provisioning, regulating, and so on) to determine how much each contributes to each land cover type.
As our calculation shows, the total ecosystem services value of Old Malda increased by about 40% (537 935 USD or about 4 crore rupees). The table you completed in Exercise A3.3 shows changes in all land cover types between 1990 and 2017. Built-up areas and water bodies increased while agricultural and vegetation land cover decreased. (Das and Das do not comment on the 63% increase in area for water bodies.)
As always, the devil is in the details, and we should only look at Exercise A3.3 as an exercise in calculating ecosystem services value, and not focus too much on the individual numbers. Similar studies from around the world have shown that natural spaces have shrunk dramatically, leading to reductions in the ‘value’ of the urban landscape by drastic amounts. Das and Das claim that this has had severe impacts on human health and wellbeing.
Summary
In this section we learned about two ways of understanding the city as an environment. One can be thought of as a metaphor, with the city being treated as a living organism. We saw that this can be a powerful way to describe and quantify the city’s dynamic processes, although it has some limitations. It omits the biotic components of the city, but is a good way to look at the level and impact of human activity.
The second way to understand a city is the ecosystems approach which takes an ecological perspective. We used the case study of Surat city to map the components of an urban ecosystem and the effects of urbanisation on abiotic and biotic components.
It is likely that both approaches are valid and can be used together for studying a city. We also saw the importance of mapping land use changes, and learned how to use simple image analysis tools for studying changes to land use. You should use this activity as a starting point for more detailed analysis.
Finally, through the concept of ecosystem services, we looked at how we can calculate the value of nature’s services. The combination of GIS and ecosystem services value analysis can provide valuable data on your neighbourhood or city, and you should try to generate such data.
A3.3 Adapting to the city
Reading and interpreting Scientific process
From nature’s perspective, cities are an explosion of a new and unusual type of environment dominated by a single species, Homo sapiens. Humans are well adapted to their urban landscapes, but what of the other species we share our cities with? Before we study the effects of urbanisation on other species, let’s define certain terms that allow us to talk about this subject.
- Synurbisation is the acclimatisation or adjustment of wild animal species to an urban environment. Leopards in the Sanjay Gandhi National Park in Mumbai are an example of this phenomenon.
- Synanthropy happens when wild or undomesticated species live in close association with humans and benefit from this association. We have many such examples in India, including dogs, cats, crows, pigeons and monkeys.15
In the last few decades, many studies have explored synurbic attributes in plants and animals, particularly emphasising species’ responses to the growing levels of air, water, noise, and light pollution. Globally, studies have shown that air and water pollution can impede respiratory and reproductive capabilities in animals, and in plants, polluted air can dramatically reduce photosynthetic capabilities and enzyme activities. The impact varies among species, for example mangoes are more tolerant of air pollution than jackfruit, lemon and neem.16
Melatonin is a chemical in our bodies that regulates our internal clock.
A lux is the illumination that falls on a 1 m2 area that is 1 metre away from the flame of a candle.
One example of this is that light pollution reduces melatonin production in humans as well as animals (Figure A3.10). We see that even exposure to very low nocturnal light levels can suppress melatonin in a range of species. Note that an illuminance of 100 lux is equivalent to a very dark day, as we would experience if the sky was covered by dark rain clouds. Light pollution can also change migratory patterns in birds and nesting behaviour in sea turtles, endangering these species.
- circadian clock
- A natural process that occurs within organisms, regulating body functions with the 24 hour cycle. This internal clock is usually synchronised with natural light and temperature conditions and regulates sleep and hunger.
Artificial light can also change the circadian clock. The change reduces chlorophyll and nitrogen content in some plants, making them more susceptible to pests and diseases.17 Similarly, noise pollution, apart from affecting humans, can change reproductive cycles and behaviour in birds, bats, insects, and very vulnerable taxa such as frogs.
Human activity that leads to various kinds of pollution can have far reaching effects on plants and animals. In the next section we will examine the effects of air pollution on a creature we wouldn’t normally consider to be much affected by this problem, the Asian honey bee (Apis dorsata).

Figure A3.10 Relationship between the number of studies and lowest illuminance of nocturnal light reported in those studies to suppress melatonin for different vertebrate groups. Humans are the most intensively studied and show melatonin suppression across a wide range of illuminance.
Adapted from Grubisic, M et al., ‘Light Pollution, Circadian Photoreception, and Melatonin in Vertebrates’, Sustainability 11, no. 22, art. 6400 (2019), doi: 10.3390/su11226400.
Case study: Air pollution and giant honeybees
Geetha Thimmegowda et al. from the National Centre of Biological Sciences (NCBS), Bengaluru (India), recently studied the effect of air pollution on giant honeybees (Apis dorsata).18 Specifically, they researched how different levels of air pollution affect the morphology and physiology of honeybees.
The researchers selected four different neighbourhoods in Bengaluru city that had different levels of air pollution: rural, low-polluted, moderately-polluted, and highly-polluted (Figure A3.11a). The particulate matter at each site was measured using a portable pollution monitoring device (Smart Air Quality Monitor with Laser Sensor). Particulate matter is a mixture of solid particles and liquid droplets found in the air. We will see later why they chose to study particulate matter.
The researchers performed the study over three years, and at each site, they chose one plant species, Tecoma stans, (a flowering ornamental plant present at all the sites) for bee observation and collection. They kept collected bees in a cage for observation and measurement of physiological parameters such as heart rate.
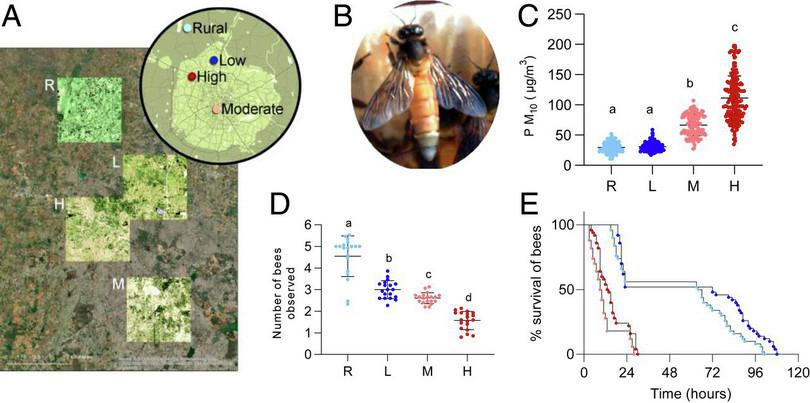
Figure A3.11 Effects of pollution on honey bees. a. Study site locations in Bengaluru city with levels of pollution in inset R = rural, L = low, M = moderate, H = high. b. Apis dorsata. c. Distribution of suspended particulate matter in the four sites. d. Number of bees counted at each site. e. Percentage of bee survival in different levels of pollution.
Thimmegowda, GG et al., ‘A Field-Based Quantitative Analysis of Sublethal Effects of Air Pollution on Pollinators’, Proceedings of the National Academy of Sciences 117, no. 34 (2020): 20653–20661, doi: 10.1073/pnas.2009074117.
Exercise A3.4 Impact of pollution on honeybees
Reading and interpretingQuantitative skillsInterpret the data shown in Figure A3.11.
- Compare the levels of suspended particulate matter in the four study sites.
- Compare the number of honeybees counted at each site.
- Compare the survival rate of bees from the four sites.
- What would you conclude about the effect of particulate matter in the air on bee numbers and survival rates?
The researchers found that particulate matter increased from rural to more polluted neighbourhoods. The number of bees collected and the percentage of bees that survived decreased from the rural area towards more polluted neighbourhoods (Figure A3.11d and Figure A3.11e).
Next, the researchers investigated why air pollution might affect bee survival. They measured the percentage of body area covered with particulate matter from pollution. Examining the wings, antennae and hind legs of the bees, they found particulate matter on bee bodies to be significantly higher in the areas with high pollution compared to the rural site (Figure A3.12). The authors also found that air pollution affected the bees physiologically by lowering their respiration rates.
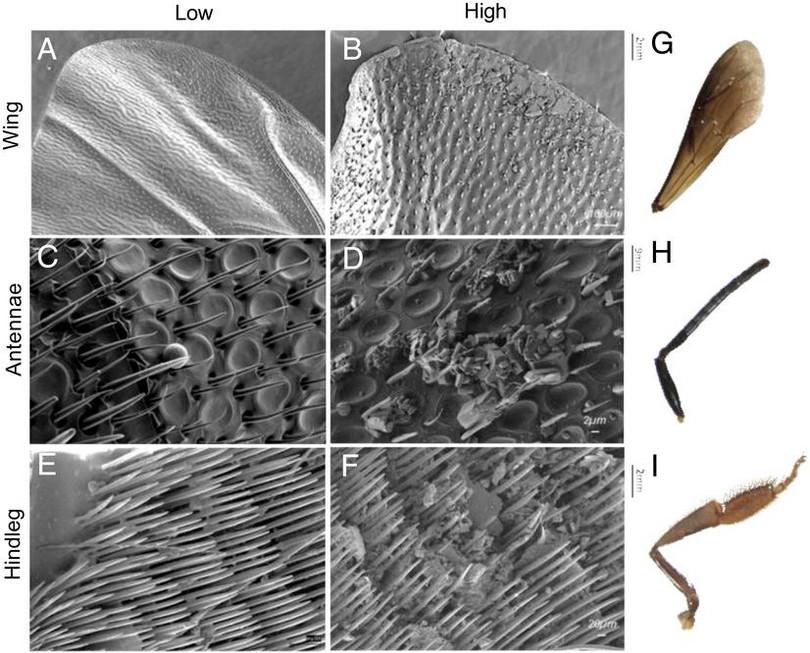
Figure A3.12 Micrographs showing the effect of low (left panel) and high (right panel) levels of pollution on different parts of the giant honeybee. Note the change in structure in each image in the right panel.
Thimmegowda, GG et al., ‘A Field-Based Quantitative Analysis of Sublethal Effects of Air Pollution on Pollinators’, Proceedings of the National Academy of Sciences 117, no. 34 (2020): 20653–20661, doi: 10.1073/pnas.2009074117.
This study shows us that pollution can have far-reaching impacts on all organisms, not just humans. Remember that the effects of pollution are not restricted to urbanscapes; its spillover effects can be felt in the rural and natural outskirts as well.
Summary
While living with humans might be advantageous for some species, it is detrimental to others. This section examined how species other than humans are adjusting (or not) to human-made novel environments. Owing to the opening of novel ecological niches, many native species might find it challenging to synurbanise into an urbanscape. Different types of human-generated pollutants have influenced the morphology, physiology, and behaviour of many species beyond repair, and we discussed a case study of the effect of pollution on honeybees.
A3.4 Cities and public health
Scientific process Quantitative skills Bridging science, society and the environment
Dogs in the city
Due to the oversupply of human food, food wastage and inefficient food disposal, most Indian cities are dealing with monumental problems of garbage scattered throughout the city. Garbage in the city is unsightly and has serious ecological consequences. It attracts vermin and pests, as well as stray animals, including dogs, cats, monkeys, mongooses, and sometimes jackals along the fringes of the cities.
Let’s take the example of dogs. The streets of Indian cities have many stray dogs. Stray dogs are domestic dogs that have bonded with humans and then been abandoned on the streets without direct human supervision or care. If stray dogs breed and their puppies never bond with humans, they become feral dogs.
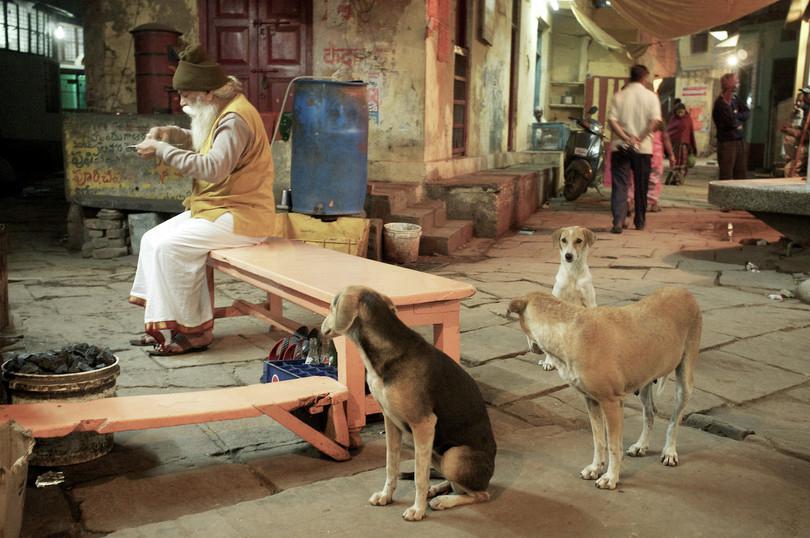
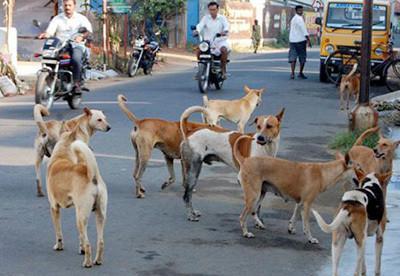
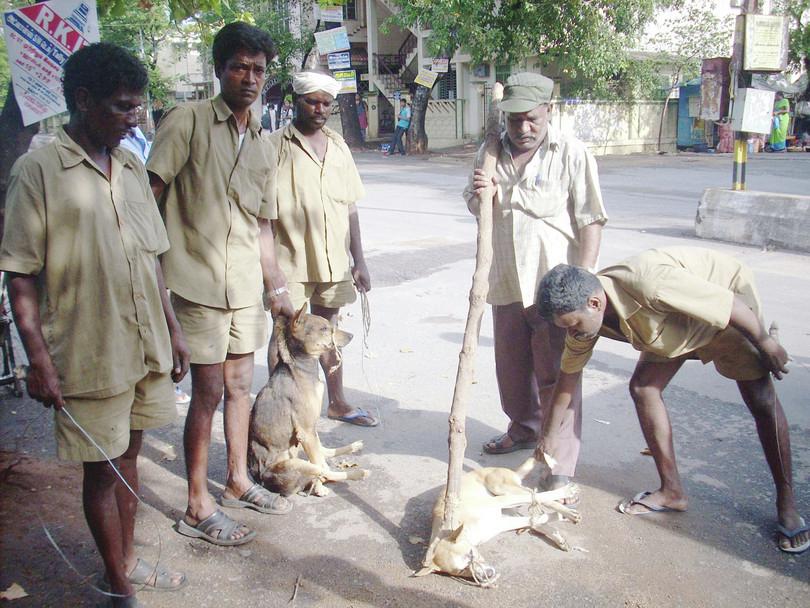
Stray dogs in a typical Indian city.
Figure A3.13 Stray dogs in a typical Indian city.
a. Hil Vanderwaal, Wikimedia Commons, CC BY 3.0.
b. Pranjal Nath, Wikimedia commons, CC-BY-SA 4.0.
c. Loganathan R, Wikimedia commons, CC-BY-SA 3.0
a. Free ranging dogs are found around restaurants and other places where food is available
b. A group of stray dogs on a street
c. Municipal workers catching stray dogs in Tamil Nadu, India
Unregulated and unmanaged waste disposal in the city, along with limited sterilisation and population control efforts, lead to an increase in stray animals in urban areas. In India, stray dog populations in cities have increased exponentially. Currently, Indian cities are known to harbour around 35–40 million stray and feral dogs, an increase of 17% since 2016.19 These dogs have many effects on urban ecosystems.
Case study: Human-stray dog interactions
In their study, Chandran and Azeez researched whether human activities could be correlated with feral dog populations in Indian metropolitan areas.20 Secondary data were collected from ten fast-growing Indian cities: Ahmedabad, Bengaluru, Chennai, Coimbatore, Delhi, Hyderabad, Mumbai, Pune, Surat and Thiruvananthapuram. Secondary data are pre-existing data collected from various sources, such as government census records, municipal reports, and newspaper articles.
Figure A3.14a shows that the human population of a city seems to correlate well with the amount of municipal solid waste in each city. This makes sense, as an increase in the number of humans leads to an increase in the amount of waste those humans generate (assuming waste disposal systems are similar across cities).
Figure A3.14b plots the dog population and number of humans bitten by dogs in a city. We can predict that these two variables are positively correlated. However, Figure 3.17b shows that this is not the case. For instance, Mumbai with a relatively low dog population (95 000) recorded high dog bite numbers (~80 000) while Hyderabad has the highest number of dogs (500 000) but a low number of dog bites per year (~50 000).


Figure A3.14 a. Population and amount of municipal solid waste for ten Indian cities. b. Stray dog population and number of dog bites per year for ten Indian cities.
Adapted from Chandran, R and Azeez, PA. ‘Stray Dog Menace: Implications and Management’. Economic and Political Weekly 51, no. 48 (2016): 58–65.
The authors studied other variables. The strongest correlation seen was that between the amount of municipal solid waste that a city generates and dog bites in a year in that city. To visualise the relationship, compare the blue line for municipal solid waste generation in Figure A3.14a with the blue line for dog bites in Figure A3.14b. The shapes of the two lines are similar.
One aspect that is clear from this study is the sheer numbers of stray dogs in our cities and the potential for human–dog conflict that this brings about. This has led to diverse opinions, with animal activists calling for humane ways to control dog populations and citizens whose lives are affected calling for more stringent measures. The conflict has sometimes led people to take extreme measures such as mass unauthorised culling of stray dog populations by poisoning.
Case study: Stray dog–wildlife interactions
The impact of stray dogs on wildlife is another serious concern resulting from rising dog populations. Researchers at the Ashoka Trust for Research in Ecology and Environment (ATREE) have studied the impact of stray dogs on native wildlife species in many different landscapes over several decades.
In 2017, ATREE reported on a country-wide survey which showed that dogs attacked almost 80 wild species, including 31 threatened species, and four species that are critically endangered according to the IUCN Red list.21 Although 32% of these attacks happened when humans used dogs for illegal hunting, 45% of attacks were by stray dog packs working independently. Jackals, foxes, hares, rodents and livestock are some of the species commonly killed by dogs (Figure A3.15). Similar impacts have been found in other countries like the UK and the USA, where stray cats have been found to cause severe impacts on native bird and invertebrate species.
As citizens, it is crucial for us to be aware of how the unregulated population increase of one species could affect other species and the ecosystem as a whole. It is essential for us to be aware of the consequences of the knowledge gap that exists among scientists, social activists, city officials, and the general public.

Figure A3.15 The number of vertebrate species observed to be negatively impacted by domestic dogs.
Adapted from Home, C, Vanak, A and Bhatnagar, Y. ‘Canine Conundrum: Domestic Dogs as an Invasive Species and Their Impacts on Wildlife in India’. Animal Conservation, 21, no. 4 (2017): 275–282, doi: 10.1111/acv.12389.
Despite the ‘stray dog menace’ situation in cities, they could benefit cities by providing ecosystem services. Each species has an ecological role or function in an ecosystem. Stray dogs’ central role in the urban ecosystem is as a carnivore and a scavenger. If you remove the top predators from this food web, the prey species increase in population.
Although stray dogs attack a large variety of species, most of their prey consists of rodents (classified as vermin)22 as well as cats and other organisms. They also play a role as scavengers by eating food discarded with garbage, road-kill, and animals that have died natural deaths.
- trophic cascade
- An ecological imbalance produced in an ecosystem by the addition or removal of top predators, which in turn affects the relative populations of species in that ecosystem.
This top-down control is known as the trophic cascade regulation of an ecosystem. If a top-level carnivore is eradicated from the system, there is a ripple effect (cascade of reactions) in the trophic system’s lower levels. Hence, vermin species such as rats will increase in a city with extremely unregulated and scattered resources. Increase in vermin may lead to the spread of diseases such as plague.
Research Highlight Leopards and the balance of nature in a city
Let’s investigate the example of one of the fastest-growing metro cities in India and the world, Mumbai. Mumbai has the largest population of stray dogs globally (estimated at 96 000 animals), which has risen due to human tolerance and hundreds of tons of food waste that accumulate within the city. However, Mumbai is also close to Sanjay Gandhi National Park which houses approximately 35 leopards that often venture into the city. A very interesting analysis has shown that the top carnivore plays a crucial role in regulating the balance of trophic levels even in an urbanscape. Based on the current statistics on dog bites and rabies, Braczlowski et al.’s study highlighted fascinating findings.23 The researchers showed that leopards (the top carnivore in this urban area) could save up to 4000 medical treatments and 90 human lives per year. The researchers estimated that in monetary terms, such an estimate could reach as high as US$ 200 000 per year, reflecting an important ecosystem service provided by leopards. With this realisation about the intricacies of the food web and how all organisms are interconnected in this web of life, be aware of this ‘balance of nature’24 and the role we play in it.25
Summary
In this section, we saw how an urban landscape works similar to a natural ecosystem and how change in one trophic level might have a cascading effect on the lower trophic levels in a city. Taking the example of stray dogs, we looked at how a top predator might have positive and negative roles within an ecosystem. On the one hand, an increase in unregulated and scattered urban resources (garbage) leads to an increase in stray dog populations with negative impacts on human health and wildlife. On the other hand, as a top carnivore in a city, dogs might be regulating the population of other species, particularly vermin, that might otherwise lead to an imbalance in the ecosystem and adversely affect human health.
A3.5 Nature relatedness
Scientific tools Bridging science, society and the environment
Do we have a relationship with nature?
Human biological evolution has followed the same process of natural selection as all other species. As with all species, we are biologically shaped by nature, a fundamental fact which evokes humility. The word ‘nature’ can have various meanings.26 It was first adopted from the Latin word, ‘natura’ meaning ‘to be born’.
Currently, urban ecosystem researchers are trying to understand the extent of humans’ inherent relationship with nature through ‘nature relatedness’. The concept of nature relatedness draws on Wilson’s (1984) biophilia hypothesis, in which he argued that because humans evolved in nature, we have an innate need to connect with the natural world surrounding us.27
Your parents or grandparents will tell you how they connected to nature in their youth. Before the advent of TV and electronic devices, children had a more personal experience with nature, becoming aware of its beauty as well as its dangers. It now feels as if children in the 1970s and 1980s were like the ‘last children in the woods’ as defined by author Richard Louv.28
The industrialisation of our society increased from the late 1980s. Urban areas expanded, resulting in the fastest rates of land use changes that our country had ever experienced. The changing land use patterns led to nature fast disappearing from our backyards. Recently, researchers have started examining peoples’ perspectives and their experiences with nature, and the positive effects interacting with nature has on health outcomes.29
- ecological economists
- People who study the trans-disciplinary field of ecological economics in which the embeddedness of the economy within the ecosystem is acknowledged and limits to economic growth are discussed.
Nature in the backyard with more vegetation cover and bird abundance is associated with lower prevalence of depression, anxiety and stress.30 Ecological economists in the UK have estimated the cost of anxiety and mood disorders to be 187.4 billion British pounds per year for Europe alone.
Children diagnosed with ADHD (attention deficit hyperactivity disorder) significantly benefit from close contact with nature. In contrast, children with less nature closeness or nature relatedness may suffer from ‘nature-deficit disorder’. Researchers have proposed a ‘nature dosage’ as a prescription or guidance for how frequently people need to engage with nature, and what types or characteristics of nature need to be incorporated into cities for the best health outcomes.31
- qualitative index
- A tool used in social science research in which a single score or measure summarises the values of more than one qualitative variable such as an attitude or emotion.
What determines nature relatedness? To understand the nature-deficit problem in urban areas, Nisbet et al. introduced a qualitative index or a self-report scale that measures one’s nature related attributes.32 They found that stronger nature relatedness is associated with greater happiness and ecologically sustainable behaviour, while disconnection from nature is detrimental to human and environmental health.
The theoretical background of nature relatedness draws on Wilson’s biophilia hypothesis, where he argued that because humans evolved in nature, we have an innate need to connect with the natural world surrounding us.27 The following are two fun activities to help you understand what Wilson meant. The first activity will help you to evaluate your nature relatedness. The second activity will help you to connect better with nature.
Exercise A3.5 Examining our nature relatedness
Scientific toolsBridging science, society and the environmentTime required: 8–10 minutes
This activity examines the nature related attribute of your personality.
For each of the following, please rate the extent to which you agree with each statement, using the scale from 1 to 5 as indicated in the table. Please respond as you really feel, rather than how you think ‘most people’ feel. This will help you to determine where you lie on the scale of nature relatedness. You can test this with yourself first and then with your friends and family to see how nature related people around you are. As suggested by the researchers, stronger nature relatedness is associated with greater happiness and ecologically sustainable behaviour, while a disconnection from nature brings about harmful consequences for both human and environmental health.
Nature relatedness scale
1 2 3 4 5 Strongly disagree Disagree a little Neither agree or disagree Agree a little Agree strongly Statements you need to rate:
- I enjoy being outdoors, even in unpleasant weather. _________
- Some species are just meant to die out or become extinct. _________
- Humans have the right to use natural resources any way we want. _________
- My ideal vacation spot would be a remote, wilderness area. _________
- I always think about how my actions affect the environment. _________
- I enjoy digging in the earth and getting dirt on my hands. _________
- My connection to nature and the environment is a part of my spirituality. _________
- I am very aware of environmental issues. _________
- I take notice of wildlife wherever I am. _________
- I don’t often go out in nature. _________
- Nothing I do will change problems in other places on the planet. _________
- I am not separate from nature, but a part of nature. _________
- The thought of being deep in the woods, away from civilisation, is frightening. _________
- My feelings about nature do not affect how I live my life. _________
- Animals, birds and plants should have fewer rights than humans. _________
- Even in the middle of the city, I notice nature around me. _________
- My relationship to nature is an important part of who I am. _________
- Conservation is unnecessary because nature is strong enough to recover from any human impact. _________
- The state of non-human species is an indicator of the future for humans. _________
- I think a lot about the suffering of animals. _________
- I feel very connected to all living things and the Earth. _________
Exercise A3.6 Nature awareness booster
Scientific toolsBridging science, society and the environmentTime required: 20–30 minutes
This activity encourages you to notice and experience nature and increases your observation skills. It involves a nature walk and recording some information. Divide your class or study circle into groups and follow the steps in sequential order.
- Take a walk to the nearest natural area that is accessible to you. It could be a park or an open space in town or some farmland.
- Take a sheet of paper and pen with you and note what you observe. Or, use the figures below to check whether you come across one or more of these types of organisms or elements. Note other things that you observe, such as sounds, smells or how things feel when you touch them.

![Images of different organisms and elements found in nature such as a plant, types of insects and animals, birds, a water body and an example of a habitat.]()
Organisms and elements found in nature.
- Take a break for five minutes and present what you experienced with the other groups. Repeat the activity, but this time with the following questions:

![A plant.]()
A plant
- Where is the plant found? How big is the plant?
- What is the colour and texture of the soil that it is found in?
- What is the size and shape of the leaf? Feel the leaf and describe its texture.
- Are there any flowers on the plant? If yes, what colour?

![An insect.]()
An insect
- What does the bug look like?
- Where did you see the bug?
- Were any other bug/insects present with the bug?
- How big is the bug?

![A bird.]()
A bird
- What colour is the bird?
- Where did you see it?
- What was the bird doing?
- Was it alone or was it with other birds?

![A water body or puddle.]()
A water body
- Where is the water located?
- Estimate how big the water body is.
- Is this area shady or not?

![A type of habitat.]()
A type of habitat
- What does the habitat look like?
- Estimate how many species occupy this habitat.
- What name would you give this habitat? For example, pond, forest, or anything else?

![A caterpillar.]()
A caterpillar
- How big is the caterpillar? What colour is it?
- Describe where it is found, for example, tree branch, or leaf or flower?
- Is the caterpillar doing any activity?

![A spider.]()
A spider
- How big is the spider? What colour is it?
- Where is it found? On a tree branch, or leaf, or flower?
- What is the spider doing?
- Is it seen with other spiders?
- Describe the sounds you hear, for example, melodious, raucous, repetitive, intrusive?
- Where do you think they are coming from?
- Describe the smell. Would you call it a strong smell or a very mild one?
- Do you like the smell?
- Where do you think it is coming from?
- Discuss your notes from your first and second observations. Do you think you were more observant when you had questions?
- Recreating and sharing your observations can often deepen your own understanding of them. Can your group think of a way to express your observations in a creative way? You could perform a short play, paint a mural, write a poem, or even choreograph a dance recital!
Summary
In this section we considered whether increasing urbanisation and development and the digital age have meant that people are more disconnected from nature than they used to be. We looked at studies that indicate that living without a connection with nature, and having a lack of compassion towards it, contribute to physical and mental health problems, and that spending time interacting with nature and exploring it can be of great benefit to our health, and to that of the environment. We examined our nature relatedness and carried out an activity to boost our connection with nature.
A3.6 Quiz
Question A3.1 Choose the correct answer(s)
Urban areas can be characterised as ecosystems because:
- Cities are made from steel and concrete, but they incorporate ecosystem characteristics such as abiotic and biotic components, energy flow and nutrient cycling.
- An ecosystem is characterised by abiotic and biotic components, energy flow and nutrient cycling, and all these features are present in an urban environment.
- An urbanised system has biotic and abiotic components, nutrient cycles and energy flow.
- There is no requirement for an ecosystem to contain large animals.
Question A3.2 Choose the correct answer(s)
By 2030, ___% of India’s population will live in urban areas.
- While the Indian population is fast urbanising, we will not have such a great proportion of the population in urban areas.
- The percentage of Indians living in urban areas was recorded as 31% of the total population in the 2011 census. This will increase by 2030 due to rapid urbanisation.
- It is expected that over 50% of the population will be urban by 2030.
- This is considerably lower than the 31% urbanised in the 2011 census.
Question A3.3 Choose the correct answer(s)
Estimate what percentage of global land is defined as built-up. (This was not discussed in the chapter.)
- While urban areas are expanding, only about 1% of global land is classified as built-up.
- This figure is higher than the global percentage.
- This figure is much higher than the global percentage.
- This percentage is closer to the correct answer of 1%, but still too high.
Question A3.4 Choose the correct answer(s)
Which of the following processes is NOT a legitimate ecosystem service?
- Pollination by insects makes our agri-intensive societies possible.
- This is a natural process that regulates the amount of dirt in water.
- This is a genuine ecosystem service that runs our modern industrialised society.
- This is part of a natural cycle where plant primary productivity can change due to climatic variations.
Question A3.5 Choose the correct answer(s)
The effects of urbanisation on bees have been the following:
- The bee population was indeed higher in rural areas than areas of high pollution.
- Pollution did adversely affect bee survival.
- Micrographs confirmed that more particulate matter was present on bees from highly polluted areas than on bees from less polluted areas.
- The authors found an inverse relationship between bee populations and the degree of urbanisation.
Question A3.6 Choose the correct answer(s)
In a trophic cascade, energy lost via heat means that tertiary consumers have access to ___% of the energy trapped by producers.
- This is the percentage of energy transferred between trophic levels.
- This is the percentage of energy lost in transfer between trophic levels.
- This is the percentage of the sun’s energy that is converted to food by producers.
- This is the percentage of energy trapped by producers that reaches tertiary consumers.
Question A3.7 Choose the correct answer(s)
Data from the study of dog bites in metropolitan areas by Chandran and Azeez is shown in the table.
| Name of metro | Dog bites in a year | Number of organisations doing animal birth control |
|---|---|---|
| Mumbai | 90 000 | 4 |
| Delhi | 80 000 | 12 |
| Hyderabad | 52 264 | 2 |
| Ahmedabad | 41 141 | 1 |
| Chennai | 38 454 | 17 |
| Bengaluru | 19 066 | 0 |
| Surat | 14 478 | 0 |
| Pune | 12 731 | 2 |
| Coimbatore | 12 000 | 1 |
| Thiruvananthapuram | 10 000 | 1 |
Select statements that you think accurately reflect the relationship between the two parameters.
- The data show no correlation between the two parameters
- The data show no correlation between the two parameters
- The data show no pattern associating number of dog bites with level of dog birth control.
- The data do not support this because Coimbatore and Thiruvananthapuram have lower dog bites and each has one organisation.
Question A3.8 Choose the correct answer(s)
Biophilia as defined by the ecologist Wilson has the following characteristics:
- Biophilia is a hypothesis put forward by Wilson, that is, it has not been experimentally proven.
- This is the central concept of Wilson’s hypothesis.
- Wilson believes that this is an innate property of human beings.
- It is still a hypothesis.
A3.7 References
-
United Nations, World Urbanization Prospects 2018: Highlights (ST/ESA/SER.A/421), Department of Economic and Social Affairs, Population Division (2019). ↩
-
United Nations, World Urbanization Prospects: The 2014 Revision, Highlights (ST/ESA/SER.A/352), Department of Economic and Social Affairs, Population Division (2014). ↩
-
Nagendra, H, Sudhira, HS, Katti, M and Schewenius, M, ‘Sub-Regional Assessment of India: Effects of Urbanization on Land Use, Biodiversity and Ecosystem Services’, in Urbanization, Biodiversity and Ecosystem Services: Challenges and Opportunities: A Global Assessment, eds T Elmqvist et al., pp. 65–74 (Dordrecht: Springer, 2013), doi: 10.1007/978-94-007-7088-1_6. ↩
-
McDonnell, MJ and Hahs, AK, ‘Adaptation and Adaptedness of Organisms to Urban Environments’, Annual Review of Ecology, Evolution, and Systematics 46, no. 1 (2015): 261–280, doi: 10.1146/annurev-ecolsys-112414-054258. ↩
-
Nagendra, H, Nature in the City: Bengaluru in the Past, Present, and Future (Oxford University Press, 2016), doi: 10.1093/acprof:oso/9780199465927.001.0001. ↩
-
World Health Organization, Urban Planning, Environment and Health: From Evidence to Policy Action (2010), accessed 24 February 2021. ↩
-
Kennedy, C, Cuddihy, J and Engel‐Yan, J, ‘The Changing Metabolism of Cities’, Journal of Industrial Ecology 11, no. 2 (2007): 43–59, doi: 10.1162/jie.2007.1107. ↩
-
Reddy, BS, ‘Metabolism of Mumbai: Expectations, Impasse and the Need for a New Beginning’. Indira Gandhi Institute of Development Research, Mumbai (January 2013). ↩
-
The Economic Times, ‘Surat to Be World’s Fastest Growing City during 2019–35: Report, 7 December 2018, accessed 15 April 2021. ↩
-
Mukherjee, F and Singh, D, ‘Assessing Land Use-Land Cover Change and its Impact on Land Surface Temperature Using LANDSAT Data: A Comparison of Two Urban Areas in India’, Earth Systems and Environment 4, no. 2 (2020): 385–407, doi: 10.1007/s41748-020-00155-9. ↩
-
Paul, BK and Rashid, H, ‘Land Use Change and Coastal Management’, in Climatic Hazards in Coastal Bangladesh, eds BK Paul and H Rashid, pp. 183–207 (Boston: Butterworth-Heinemann, 2017), doi: 10.1016/B978-0-12-805276-1.00006-5. ↩
-
Pramanik, S and Punia, M, ‘Land Use/Land Cover Change and Surface Urban Heat Island Intensity: Source–Sink Landscape-Based Study in Delhi, India’, Environment, Development and Sustainability 22, no. 8 (2020): 7331–7356, doi: 10.1007/s10668-019-00515-0. ↩
-
Daily, GC et al., ‘The Value of Nature and the Nature of Value’, Science 289, no. 5478 (2000): 395–396, doi: 10.1126/science.289.5478.395. ↩
-
Das, M and Das, A, ‘Dynamics of Urbanization and its Impact on Urban Ecosystem Services (UESs): A Study of a Medium Size Town of West Bengal, Eastern India’, Journal of Urban Management 8, no. 3 (2019): 420–434, doi: 10.1016/j.jum.2019.03.002. ↩
-
Luniak, M, ‘Synurbization: Adaptation of Animal Wildlife to Urban Development’, in Proceedings of the 4th International Symposium on Urban Wildlife Conservation, pp. 50–55 (University of Arizona, 2004). ↩
-
Kuddus, M, Kumari, R and Ramteke, P, ‘Studies on Air Pollution Tolerance of Selected Plants in Allahabad City, India’, Journal of Environmental Research and Management 2, no. 3 (2011): 42–46. ↩
-
Singhal, RK, Kumar, M and Bose, B, ‘Eco-Physiological Responses of Artificial Night Light Pollution in Plants’, Russian Journal of Plant Physiology 66, no. 2 (2019): 190–202, doi: 10.1134/S1021443719020134. ↩
-
Thimmegowda, GG et al., ‘A Field-Based Quantitative Analysis of Sublethal Effects of Air Pollution on Pollinators’, Proceedings of the National Academy of Sciences 117, no. 34 (2020): 20653–20661, doi: 10.1073/pnas.2009074117. ↩
-
Times of India, ‘Why Stray Dogs Divide India like Nothing Else’, 15 March 2021, accessed 15 April 2021. ↩
-
Chandran, R and Azeez, PA. ‘Stray Dog Menace: Implications and Management’. Economic and Political Weekly 51, no. 48 (2016): 58–65. ↩
-
Home, C, Vanak, A and Bhatnagar, Y, ‘Canine Conundrum: Domestic Dogs as an Invasive Species and Their Impacts on Wildlife in India’, Animal Conservation, 21, no. 4 (2017): 275–282, doi: 10.1111/acv.12389. ↩
-
Forest, D, ‘Street Dogs Keep the Developing World from Going to the Rats’, Animal People (1 July 2001). ↩
-
Braczkowski, AR, O’Bryan, CJ, Stringer, MJ, Watson, JEM, Possingham, HP and Beyer, HL, ‘Leopards Provide Public Health Benefits in Mumbai, India’, Frontiers in Ecology and the Environment 16, no. 3 (2018): 176–182, doi: 10.1002/fee.1776. ↩
-
Pimm, SL, ‘The Balance of Nature? Ecological Issues in the Conservation of Species and Communities’ (Chicago: University of Chicago Press, 1991). ↩
-
Simberloff, D, ‘The “Balance of Nature”: Evolution of a Panchreston’, PLOS Biology 12, no. 10 (2014): e1001963, doi: 10.1371/journal.pbio.1001963. ↩
-
Ducarme, F and Couvet, D, ‘What Does “Nature” Mean?’, Palgrave Communications 6, no. 14 (2020): doi: 10.1057/s41599-020-0390-y ↩
-
Wilson, EO, Biophilia (Cambridge: Harvard University Press, 1984) ↩ ↩2
-
Louv, R, Last Child in the Woods: Saving Our Children from Nature-Deficit Disorder (London: Atlantic Books, 2013). ↩
-
Burkhardt, MA, ‘Healing Relationships with Nature’, Complementary Therapies in Nursing and Midwifery, 6, no. 1 (2000): 35–40, doi: 10.1054/ctnm.1999.0438. ↩
-
Cox, DTC et al., ‘Doses of Neighborhood Nature: The Benefits for Mental Health of Living with Nature’, BioScience 67, no. 2 (2017): 147–155, doi: 10.1093/biosci/biw173. ↩
-
Shanahan, DF, Bush, R, Gaston, KJ, Lin, BB, Dean, J, Barber, E and Fuller, RA, ‘Health Benefits from Nature Experiences Depend on Dose’, Scientific Reports 6, no. 1 (2016): 28551, doi: 10.1038/srep28551. ↩
-
Nisbet, EK, Zelenski, JM and Murphy, SA, ‘The Nature Relatedness Scale: Linking Individuals’ Connection with Nature to Environmental Concern and Behavior’, Environment and Behavior 41, no. 5 (2009): 715–740, accessed doi: 10.1177/0013916508318748 ↩

.jpeg)
catchingTAMILNADU36India.jpg)