D1 Feline fables
D1.1 Introduction
-
Capacities taught in this chapter
Scientific processHow do we study how cats coexist?Scientific toolsHow do we count or estimate populations?
How do we establish wildlife corridors?Reading and interpretingHow are cats distributed around the world?Bridging science, society and the environmentHow does population monitoring help in conservation?
How can citizens get involved in science?
It seems pertinent to start this chapter, ‘feline fables’, with our notions of what felines are.
- felids
- Animals that belong to the family of cats.
- The name ‘felines’ is a synonym for felids, that belong to the family Felidae (cats) in the order Carnivora. They are markedly different from the family Canidae (dogs), which is also included in the order Carnivora.
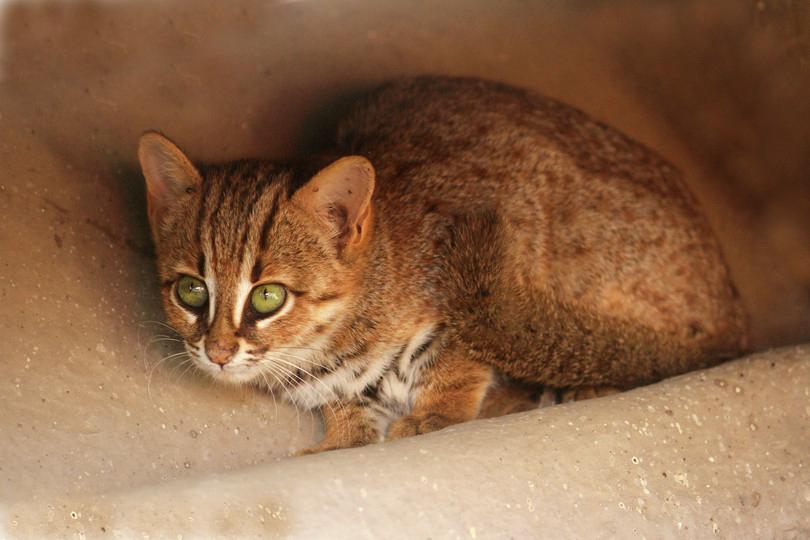
- Felids vary in size from the largest cat, the Siberian tiger (200–325 kg), to the smallest, the rusty-spotted cat (~1 kg).
- All cats belong to the family Felidae, which comprises two subfamilies; the Pantherinae (big cats) and Felinae (small cats).
- mesopredator
- A predator of medium size that exists in the middle trophic level and whose population is influenced by the presence of top carnivores in the ecosystem.
A furry little kitten stretching its paws appeals to many people, while a tiger crouching induces fear. Nevertheless, cute kittens and majestic tigers are behaviourally very similar, despite their physical differences. The behaviour of felids is similar across countries and even continents, suggesting that ‘cats are basically cats’.1 They are fierce carnivores, meso-to-top predators of their food chain, because they only eat vertebrate flesh. The small cats differ from large cats as they have a hyoid bone linking the larynx to the skull base, allowing small cats to purr instead of roar.
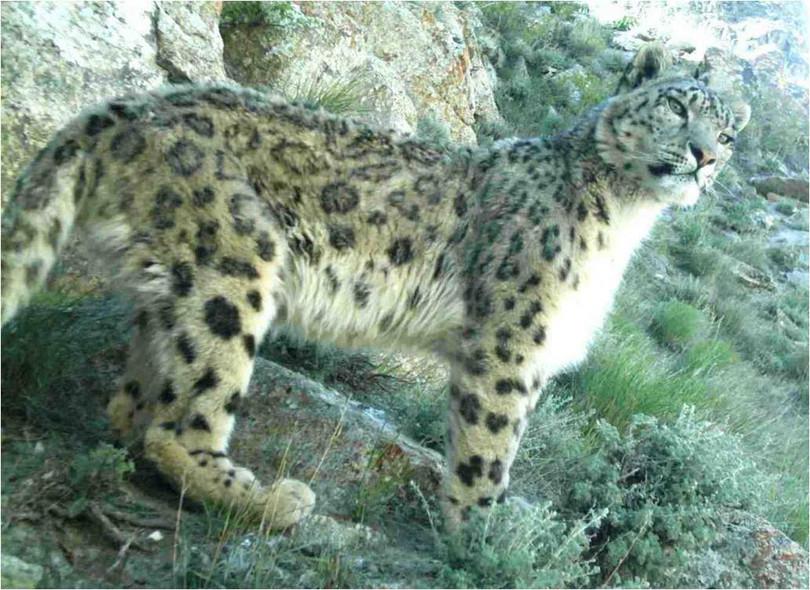
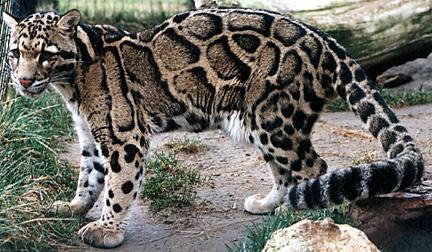
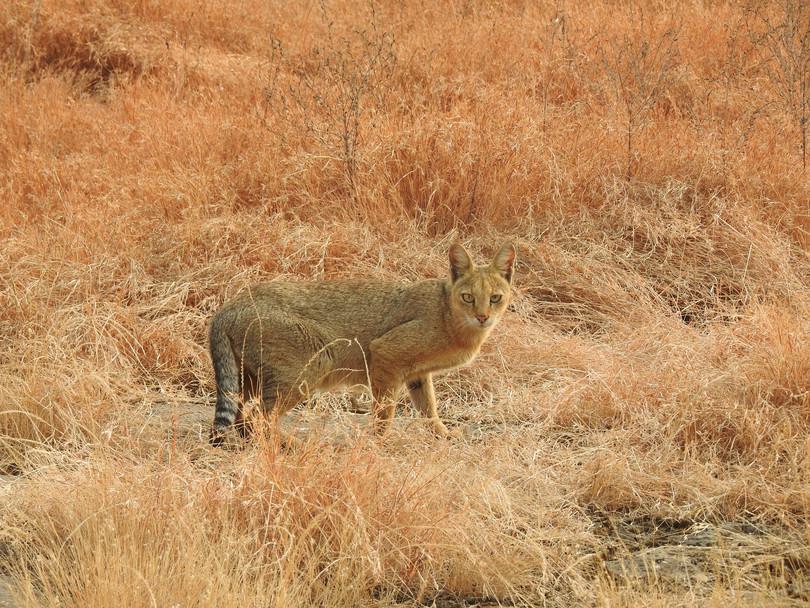
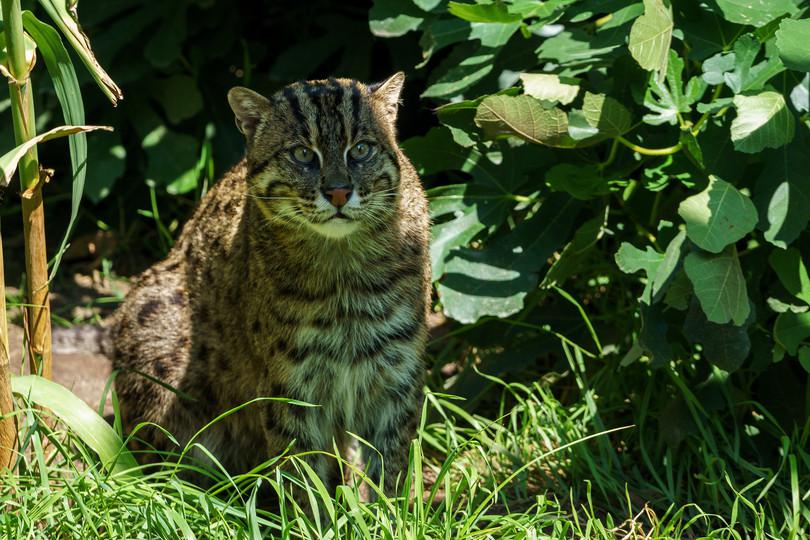
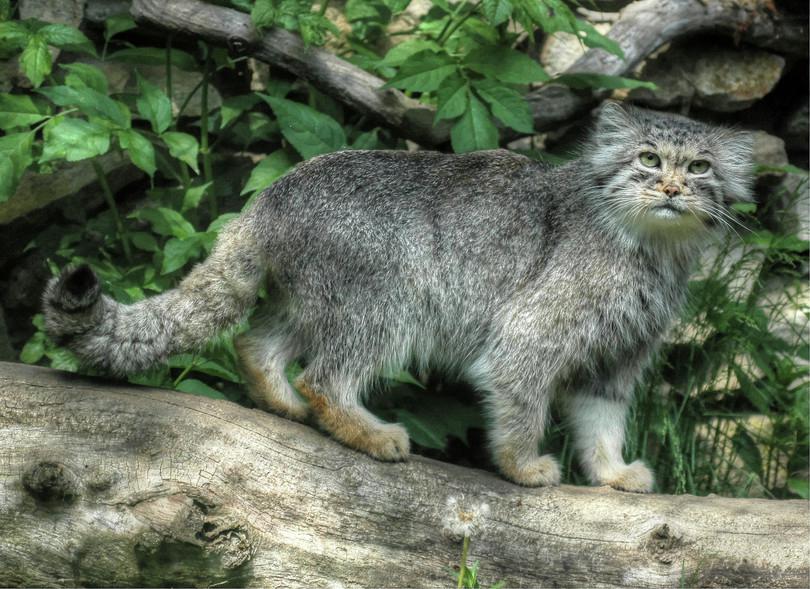
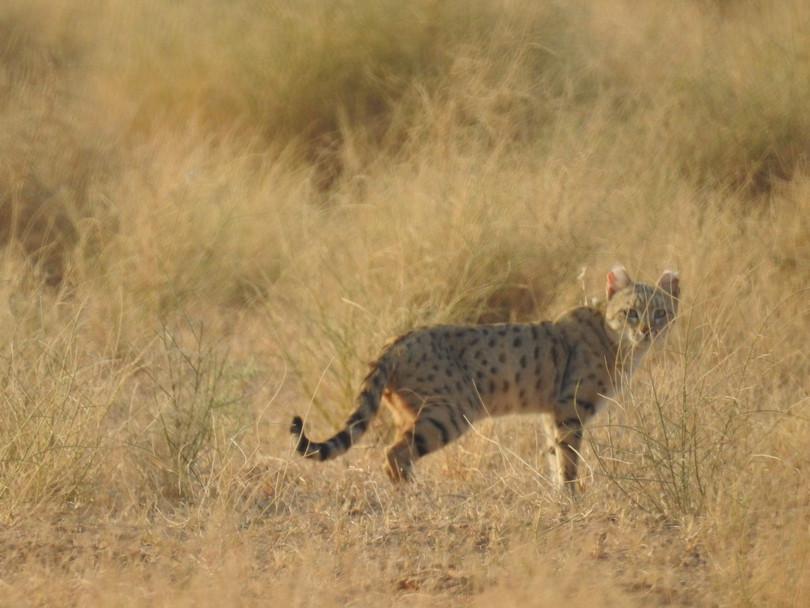
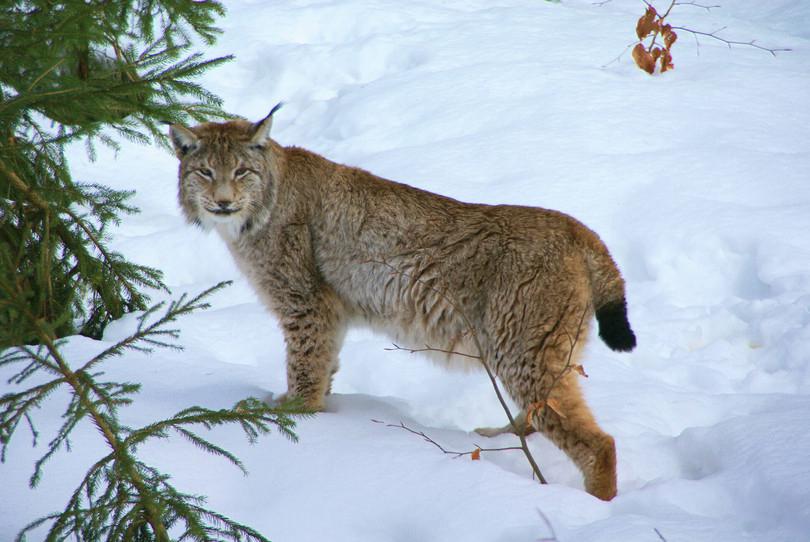
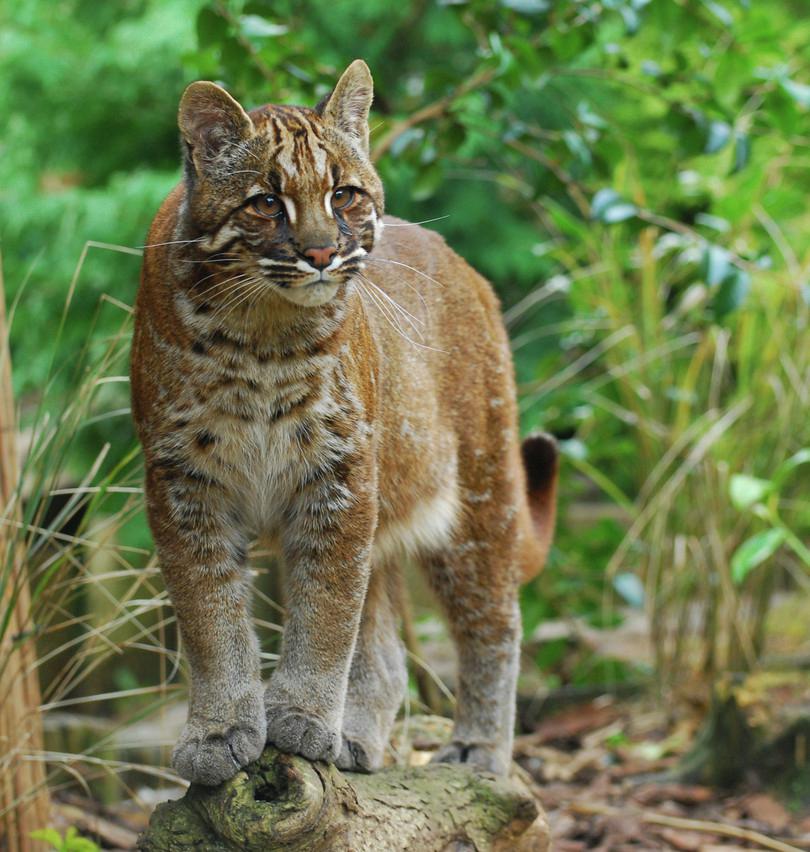
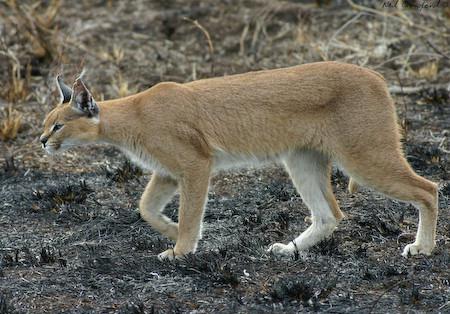
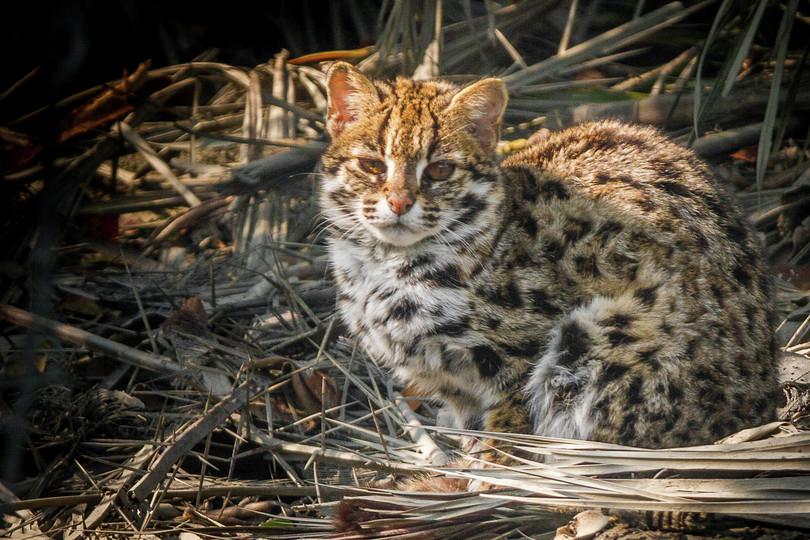
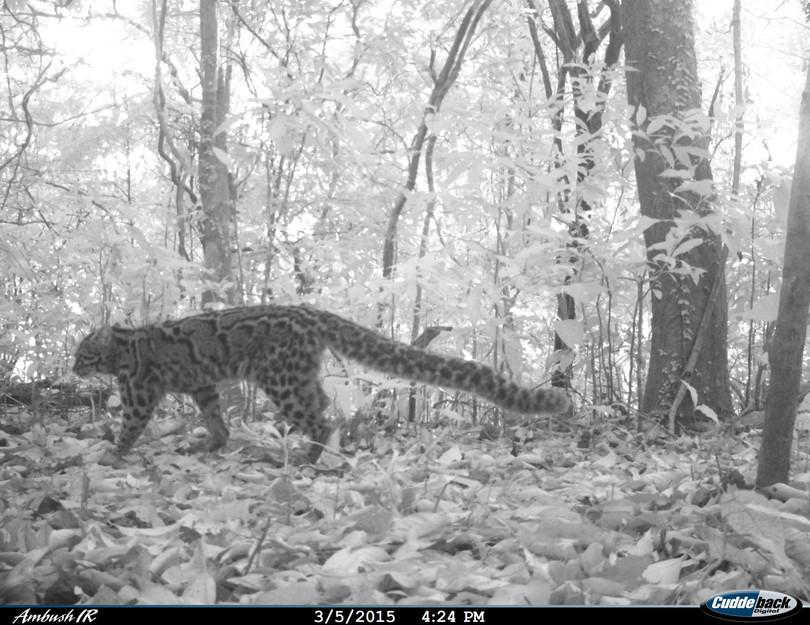
At least 41 species of cats are recognised throughout the world, although molecular research suggests that there might be a few more. India is home to 15 species of wild cats, crowning it as the most felid-diverse country in the world (see Figure D1.1). Among these 15 species, India has 10 small cat species, which is also the highest globally.

The name of Jim Corbett is synonymous with cats. He was a famous hunter who later became a naturalist. Corbett’s stories of stalking and killing of many human-eating tigers of the Kumaon and Garhwal regions of the Himalaya are legendary (Man-eaters of Kumaon). Although he killed at least 19 tigers and 12 leopards, Jim Corbett played a key role as a pioneer conservationist and was instrumental in establishing the Hailey National Park in 1936 in present day Uttarakhand. The name of the park was changed to Jim Corbett National Park in his honour in 1955 by the Indian Government.
Global land-use change patterns (see Figure A3.8) have led to habitat loss for many felids including tigers, lions, leopards and snow leopards. In India and worldwide, many government and non-government organisations such as the National Tiger Conservation Authority, Panthera, Snow Leopard Trust, and WWF have initiated cat conservation efforts. However, owing to the charisma of big cats, most conservation efforts have been dedicated to the big cats, neglecting the smaller cats.
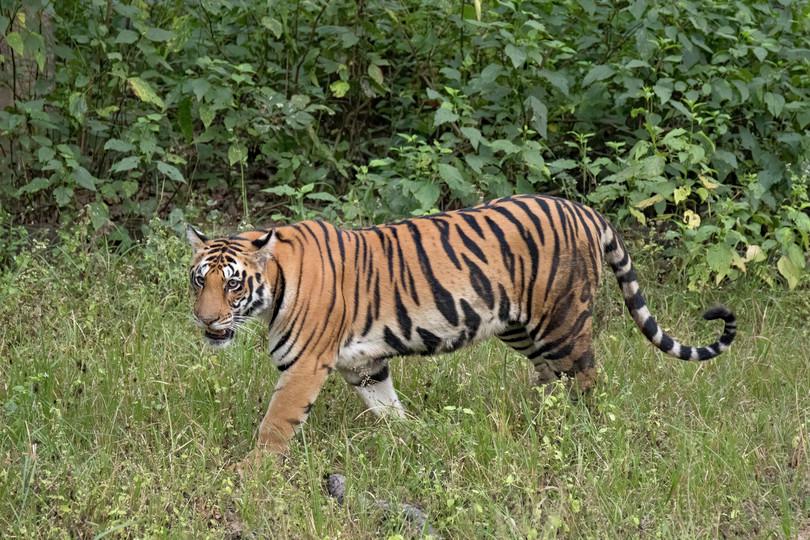
Figure D1.1 Felid species that occur on the Indian subcontinent.
a. Charles J. Sharp, Wikimedia Commons, CC BY-SA 4.0.
b. Tony Hisgett, Wikimedia Commons, CC BY-SA 2.0.
c. Srikanth Sekaar, Wikimedia Commons, CC BY-SA 2.0.
d. USAID Afghanistan, Wikimedia Commons, CC BY-SA 2.0.
e. Wikimedia Commons, CC BY-SA 3.0.
f. Dr. Raja Kasamba, Wikimedia Commons, CC BY-SA 4.0.
g. Matthias, Wikimedia Commons, CC BY-SA 3.0.
h. Gitanes232, Wikimedia Commons, CC BY-SA 4.0.
i. Raja Bandi, Wikimedia Commons, CC BY-SA 4.0.
j. Aconcagua, Wikimedia Commons, CC BY-SA 3.0.
k. Karen Stout, Wikimedia Commons, CC BY-SA 2.0.
l. Ragnhild & Neil Crawford, Wikimedia Commons, CC BY-SA 2.0.
m. Soumyajit Nandy, Wikimedia Commons, CC BY-SA 4.0.
n. Davidvraju, Wikimedia Commons, CC BY-SA 4.0.
o. Wildlife Conservation Research Unit, University of Oxford.
Charles J. Sharp, Wikimedia Commons, CC BY-SA 4.0.
Tony Hisgett, Wikimedia Commons, CC BY-SA 2.0.
Srikanth Sekaar, Wikimedia Commons, CC BY-SA 2.0.
USAID Afghanistan, Wikimedia Commons, CC BY-SA 2.0.
Wikimedia Commons, CC BY-SA 3.0.
Dr Raja Kasamba, Wikimedia Commons, CC BY-SA 4.0.
Matthias, Wikimedia Commons, CC BY-SA 3.0.
Gitanes232, Wikimedia Commons, CC BY-SA 4.0.
Raja Bandi, Wikimedia Commons, CC BY-SA 4.0.
Aconcagua, Wikimedia Commons, CC BY-SA 3.0.
Karen Stout, Wikimedia Commons, CC BY-SA 2.0.
Ragnhild & Neil Crawford, Wikimedia Commons, CC BY-SA 2.0.
Soumyajit Nandy, Wikimedia Commons, CC BY-SA 4.0.
Davidvraju, Wikimedia Commons, CC BY-SA 4.0.
Wildlife Conservation Research Unit, University of Oxford
In this chapter, we explore the life of cats and emphasise a few key skill-building capacities. First, looking through the lens of biogeography, we try to understand why there are so many species of cats on the Indian subcontinent. Then we delve into the community connections in cats and how competition leading to niche partitioning can lead to the stable coexistence of cat species. Further, we look at how abundant these cats are and how one can estimate their population and monitor them for the sake of conservation.
Estimating populations becomes important as rapid land-use changes have destroyed the habitats of many wild species, and cats are among the most affected. It has become vital to sustain populations and maintain continuity across populations to ensure gene flow. Wildlife corridors can be established to provide continuity among metapopulations (disjunct populations). We have also included information on how being a citizen and interested in science, one might contribute towards the conservation of some of these majestic species (citizen science).
D1.2 Biogeography of felids
Reading and interpreting Scientific process
Wild felids occupy all continents apart from Australia and Antarctica. We need to clarify a few terms before studying the biogeography of felids in India and why India harbours such high diversity of felids.
- biogeography
- The study of the distribution of flora, fauna and other life forms across time and space, including the patterns and factors that are responsible for variations in the distribution.
- biogeographic realms
- Any of the spatial divisions of the Earth’s land surface based on common biological evolutionary history and patterns of distribution of life forms.
Biogeography is the science of documenting and understanding spatial patterns of biodiversity. This includes the study of organisms in geographic space and in geological time. Biogeographic realms or ecozones delineate large areas of the Earth’s surface within which organisms have evolved over long periods of time. Biogeographic realms are characterised by the evolutionary history of the organisms they contain and the patterns of distribution of these organisms, shaped by plate tectonics that redistributed the world’s land masses over geological history.

Figure D1.2 Biogeographic realms of the world.
Figure D1.2 shows seven of the eight biogeographical zones of the Earth that are classified according to the dominant floristic and faunal compositions. According to the continental drift hypothesis, all the Earth’s continents were joined as the supercontinent Pangaea about 300 million years ago. Pangaea began to break apart about 200 million years ago as sections drifted slowly away from each other. The breakup of Pangaea allowed continental landmasses to separate in one part of the world and then fuse and reorganise with landmasses elsewhere.
Originally, the idea of continental drift was proposed by Abraham Ortelius (a geographer) in 1596, but it was later modified and fully developed by Alfred Wegener (a geophysicist) in 1912. The theory of continental drift was based on the interpretations of geologists, geographers, and even biologists, which were based on the shapes of the continents, and the flora and faunal elements and similarities among them. Continental drift received substantial scientific support from the theory of plate tectonics in the early 1960s. The theory of plate tectonics proposed that Earth’s lithosphere has eight major tectonic plates that are constantly moving and gave rise to the major landforms as they exist at present.2 3 4
The eight biogeographic realms are unique in their paleogeographic formation and biodiversity attributes. For example, while the Palearctic realm contains some of the temperate and desert ecosystems of the world, the Nearctic includes the Arctic tundra (treeless) and taiga or snow forest vegetation with its own set of faunal elements. On the other hand, the Indomalayan realm contains some of the richest and highly diverse tropical and subtropical broadleaf forest elements of the world. Going into the details of each of these realms is beyond the scope of this chapter.
Paleogeography is the study of historical geographic landscape, generally of the physical features of the landscapes.
Do the biogeographic realms, each having unique habitat and environmental characteristics, explain why the Indian subcontinent has the highest diversity of felids? The Indian subcontinent has very high floristic diversity because it includes elements from three different biogeographic realms (Indomalayan or Oriental, Palearctic, and Afrotropical), but this alone does not explain why felid diversity is so high in India. Warren Johnson and co-workers from Texas A & M University explored the pathways by which felids radiated across the globe during the Miocene period.5 This study can help us understand the evolutionary processes that gave rise to such high felid diversity in India. Their study of felid evolutionary trajectories resolved many controversies related to the evolution and divergence of this group.
- mya
- Million years ago.
Similar to the rice phylogenetic tree shown in Figure C1.1, Johnson and others constructed a phylogenetic tree of felids using molecular techniques, shown in Figure D1.3. Felids first evolved about 25 mya in ancient Eurasia (Palearctic realm). Eight distinct groups of felids started diverging from the ancient felids about 11 mya, the first being the pantherine lineage.
Take some time to study Figure D1.3. Note the colours that represent the zoogeographical regions on the map, and the corresponding species on the phylogenetic tree. In the tree, at the bottom left, lies the outgroup (in black lines) - ignore this group while reading this tree. Focus on node 1, it represents the last common ancestor of all other lineages on the tree. The terminal ends of the nodes are labelled with three-letter codes to represent the scientific names (colour-coded and italicised) written along its side. On the right side of the scientific names, common names are written and on the extreme right, eight major lineages are given. Each lineage represents all the species that have descended from a common ancestor. The numbers written in red colour on nodes 1 to 7 represent the time (my = million years) when the major splits occurred.
- speciation
- The evolutionary process by which a group within a species separates from other members of its species, develops its own unique characteristics, and forms a distinct kind of species.
Johnson and others show that early pantherines migrated between continents when the sea levels were low during ice ages. New species arose through radiation and subsequent colonisation (a population colonising a new area and environment and evolving there). When sea levels rose again between 6.4 and 2.9 mya, the populations were isolated from each other and adapted to their local environments. Isolated populations became new species (speciation through adaptive radiation). A good example of adaptive radiation would be the ocelot lineage, the only lineage that evolved in South America, as shown in Figure D1.3.
Extra reading Evolutionary radiation
- clade
- A group of organisms that encompasses all the descendants that have evolved from a common ancestor.
Evolutionary radiation refers to a rapid increase in diversity of a particular clade (group of organisms). In the usual evolutionary patterns observed, there is a positive balance between the number of appearances and extinctions of species within a clade. However, during evolutionary radiation, this balance moves towards higher rates of speciation, which may or may not accompany divergence in morphology. Radiations may occur in one lineage or many lineages at the same evolutionary time. It may take place rapidly or slowly. For example, the lineage of apes also diverged due to evolutionary radiation during the Miocene, at the same time as the felids. Adaptive radiation, on the other hand, is rapid evolutionary radiation that is driven by a single lineage’s adaptation to its environment.
The great radiation that took place 23.03 to 5.33 mya is of great interest to geologists and paleo-climatologists (scientists who study ancient climate). The geology of the Himalaya changed significantly during this period as the Arabian Peninsula collided with Eurasia, which established a connection between the Mediterranean and the Indian Ocean. This also caused changes in monsoonal patterns. Felids, primates, and many other placental mammals radiated and diversified during this period. Temperatures cooling relatively rapidly and the mass extinction event 65 mya might have triggered evolutionary radiation at this time. More information can be found in the book Chromosomal Evolution in Higher Plants by Stebbins.6
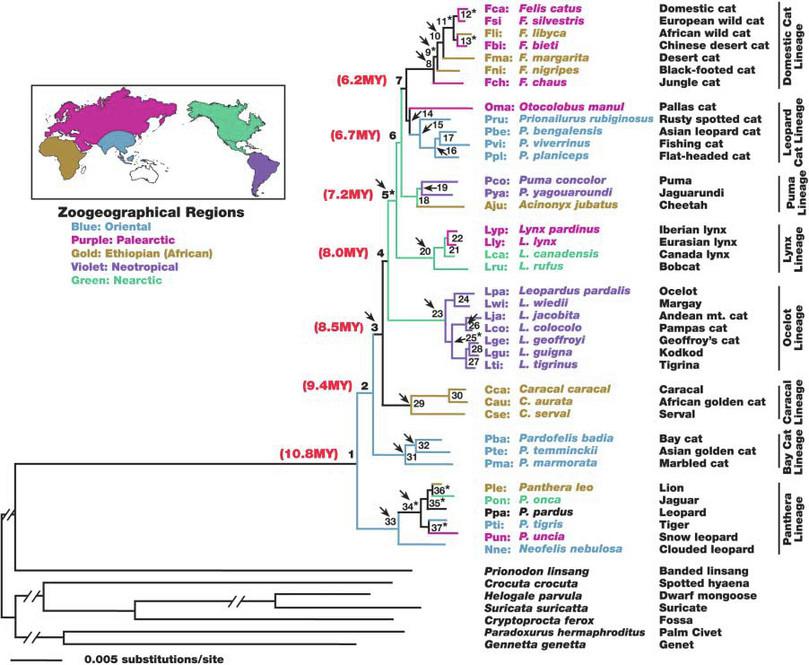
Figure D1.3 Phylogenetic tree derived from genetic data showing the evolutionary history of felids from about 11 mya.
Johnson, WE et al., ‘The Late Miocene Radiation of Modern Felidae: A Genetic Assessment’, Science 311, no. 5757 (2006): 73–77, doi: 10.1126/science.1122277.
Note that the biogeographical realms are sometimes differently classified by different scientists, as in Figure D1.2 and Figure D1.3, suggesting that there are different systems of classification, and scientists often don’t agree with each other.
To understand why India has such a great diversity of cats, we must understand the migratory routes of the different species. The Indian subcontinent is the place of origin of some cat species (such as the tiger in southeast Asia), but it was also well connected to the migratory pathways of many of the felids. India, arising from different continental plates, provided similar habitats for newly colonising species from different parts of the world. So diversification in India mainly occurred through colonisation, when sea levels were low and the different continents were connected through a corridor of landmasses. Figure D1.3 shows evidence supporting colonisation, because the Oriental (Indomalayan) and the Palearctic species are scattered throughout the phylogenetic tree.
In contrast, the Neotropical region has two species in the Puma lineage, but most of its species are concentrated in the ocelot lineage. This suggests that most diversification in the Neotropics occurred through sympatric speciation rather than a new species arriving and colonising the environment.
Exercise D1.1 Interpreting the evolution of felids
Reading and interpretingRead about phylogenetic trees in the evolution primer.
Study Figure D1.3 and answer the following:
- Where did the caracal lineage evolve?
- Did the caracal lineage evolve through radiation or colonisation? Support your answer with reference to Figure D1.3.
- Where are most lynx species distributed throughout the world?
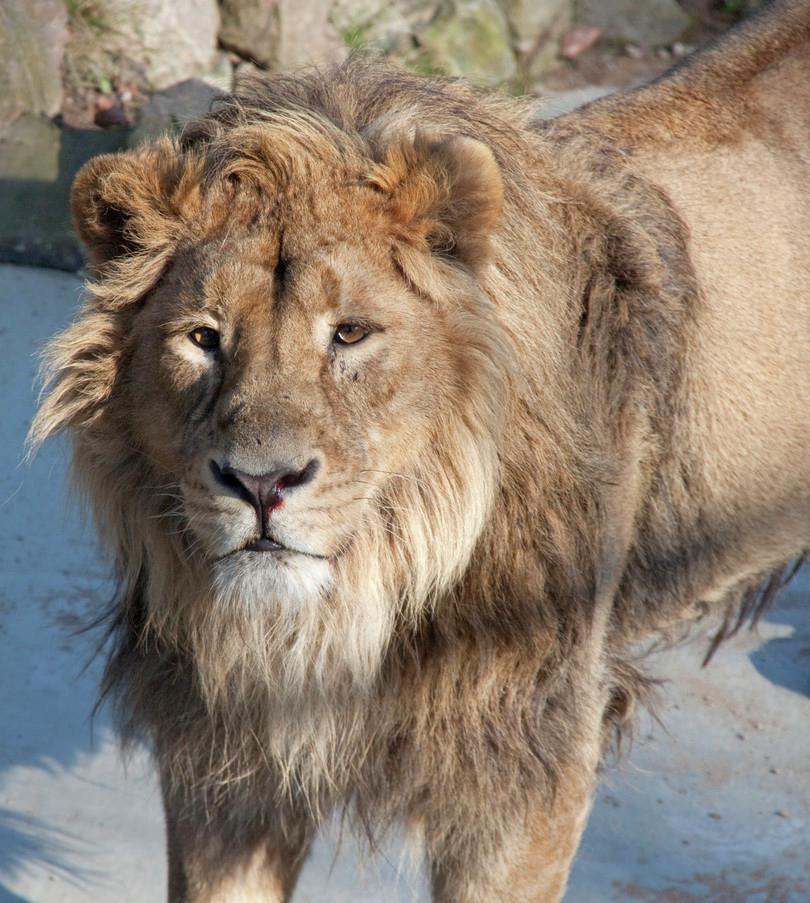
- The only surviving population of Asiatic lions is found in Gujarat, India. Where did Asiatic lions originally come from? Support your answer with reference to Figure D1.3.
- Explain the evolution of the ocelot lineage by referring to Figure D1.3.
Summary
The drifting of continents over geological time has given rise to the shapes and sizes of the continents that we see today. This also gave rise to eight biogeographic realms or zones unique in their floral and faunal elements. Greater diversity of felids could be attributed to the merging of biogeographic zones in some regions, while in other regions, long-distance migration enabled species to colonise new areas and radiate. Colonisation was possible when sea levels fell during ice ages and animals could migrate across continents through land corridors. When sea levels rose between ice ages, within-continent speciation events led to adaptive radiation.
D1.3 Territoriality and home range: how do cats coexist?
Scientific process
All felid species, except lions, are solitary. They might form mating pairs during the mating season, and mothers move with their kittens or cubs when they are young, but they spend most of their lives as solitary individuals. Being solitary, they are elusive and often low in abundance. This trait makes them difficult to locate for study purposes. When studying the ecology and behaviour of felids, a scientist should first establish how many individuals there are in an area. This helps to understand the population status of a species. The social behaviour of felids reflects how these cats are distributed in a landscape.
In order to understand the spatial distribution of animals, let us first learn two interrelated, yet distinct terms: territoriality and home range.
Territoriality
Territoriality is a behavioural trait in which an animal defends certain resources,7 such as space for establishing its den, food sources, or mates (Figure D1.4). Territoriality occurs in many vertebrate species and has been shown in invertebrates, and occurs in both solitary and social-living animals.
- intraspecific
- Relating to or occurring between individuals of the same species.
Territoriality enables individuals to coexist harmoniously so that they avoid intraspecific competition. Territoriality is vital for animals, but how big should a territory be? Here are a few details about territoriality that will help you to understand how felids coexist and avoid competition.
- The territory size of an animal is inversely proportional to its population density, so the more animals there are, the smaller their territories.
- A larger predator requires more energy to maintain its size. Therefore, the number of prey that a predator consumes must match its metabolic requirement. This, in turn, means that a larger predator will require a larger territory which contains more prey.
- A male individual defends its territory for females, while a female does it for food resources to meet its energetic requirements and satisfy the energetic requirements of lactation and offspring rearing.
- Male territories are far larger than females’ territories, and encompass the territories of two to three females.
The concept of territoriality is complicated in the world of carnivores. Felids, in particular, have scent glands on their cheeks, paws, and flanks that they rub on surfaces to scent mark (or delineate) their territory. Big cats often urinate around their territory to mark it, and visit their boundaries often to renew the scent. These territorial markings are generally respected by neighbours to reduce direct conflict and harmoniously coexist with others.
Home range
An animal’s home range is an area where it pursues regular activities, meeting its resource and reproductive requirements as an individual or as a group. To put it simply, your home is your territory that you would defend against others, but the neighbourhood where you shop, socialise, and go to work would be your home range (Figure D1.4).
Interspecific competition
- interspecific
- Relating to or occurring between individuals of different species.
Interspecific competition (competition between different species) occurs when felids of different species compete for similar resources. The niche concept describes the range of biotic and abiotic conditions that a species requires to survive in an environment. Interspecific competition thus intensifies when a species rather than an individual of the same species intrudes into another species’ niche.

Figure D1.4 Hypothetical quadrats of six occupants of the same species and sex, displaying their territory and home ranges.
Adapted from Burt, WH, ‘Territoriality and Home Range Concepts as Applied to Mammals’, Journal of Mammalogy 24, no. 3 (1943): 346–352, doi: 10.2307/1374834.
The Lotka-Volterra competition model is widely used in ecology to understand two-way species interaction. This mathematical model shows that in a two-species system, harmonious coexistence of two species is possible when the interspecific competition effect is greater than the intraspecific effect of competition, which means that you are more limited by your own kind (intraspecific) than by others (interspecific). Read more about this model in this article.
Exercise D1.2 Observing territoriality
Scientific tools
- Select an animal in your neighbourhood or a pet in your house.
- Follow every activity of the animal, by noting down where it sleeps, where it eats, and so on.
- Hand-draw a map of the area the animal uses (something similar to Figure D1.4)
- Delineate where the animal spends most of the time alone (or with a partner) and with others.
- Based on the concepts discussed in this section, identify the animal’s territory and home range.
Extra reading Niches and niche partitioning
- ecological niche
- Defines the ‘role’ of a species within their environment, including all the environmental (abiotic) factors and interspecies interactions that influence the population of that species.
- fecundity
- The measure of the maximum reproductive potential of an individual or population.
The scientist G. E. Hutchinson in 1959 characterised an ecological niche as an abstract environmental space, with multidimensional axes of abiotic and biotic factors influencing the birth, death, and fecundity (reproductive fitness) of a species. His niche concept is widely accepted in ecology.8
- fundamental niche
- All the environmental conditions in which an organism is able to live and utilise biotic and abiotic factors in the absence of competition or pressure from other species.
- realised niche
- The environmental conditions within the fundamental niche that it actually occupies in the presence of competition or limiting factors.
A species is able to survive and reproduce under a set of environmental conditions called its fundamental niche. Factors such as competition or predation restrict a species to a subset of its fundamental niche called its realised niche.
- niche partitioning
- Also known as resource partitioning, it is the evolution of two species competing for identical resources to have niches distinct to one another, thereby avoiding the negative effects of interspecific competition. See also: ecological niche.
- guild
- A multi-species group (often closely related) whose members rely on similar resources. An example could be different bird species that use similar techniques for insect foraging.
When two species with similar niches (a guild) overlap in an area (niche overlap), they compete with each other. Species A may outcompete species B, leading to its extinction. The two species can continue to coexist if niche partitioning occurs, possibly leading to speciation.

a. An (abstract) hypervolume of environmental (abiotic and biotic) axes that influence the fundamental niche of a species. b. A hypothetical representation of the fundamental niche (that a species could possibly occupy) and its realised niche (that it actually occupies).
Two species cannot harmoniously coexist in one area when the two species’ niche requirements (resource, space, mating) are very similar. While we can find out if and how two small species compete by conducting controlled experiments in the lab, this is a difficult task for larger animals such as large mammals. Most large mammal studies of competition and coexistence are therefore observational rather than experimental, looking at patterns of distribution of organisms and their corresponding resources.
One way of studying niche overlap has been to analyse the dietary overlap of different felid species. Since it is often challenging to locate an individual and follow it to record what it eats, scientists often rely on faecal analysis (scat samples) to study the diet of large mammals.
A case study on interspecific competition: dietary overlap in three sympatric carnivores
- sympatric
- Existing or occurring in the same geographical area. See also: allopatric.
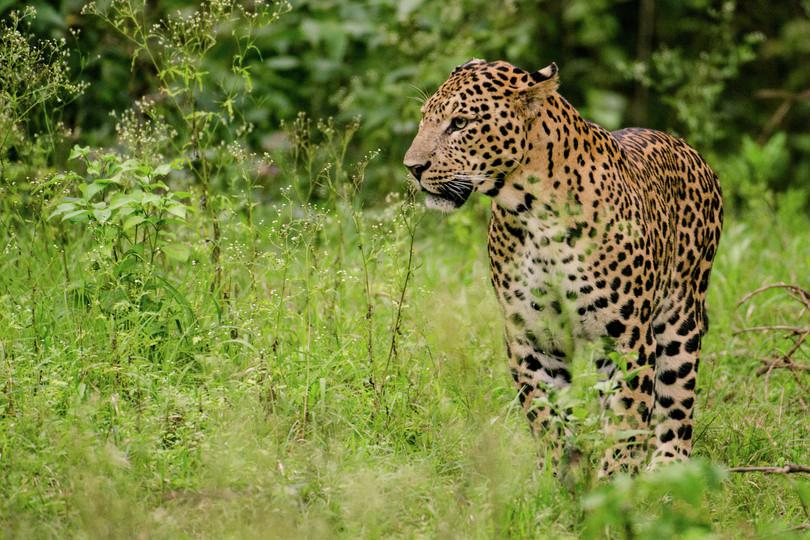
One such study was conducted by Ullas Karanth from the Wildlife Conservation Society India programme, Bengaluru, and his graduate student A. P. Andheria, in the Bandipur Tiger Reserve of Karnataka. They studied the dietary overlap of three sympatricspecies, the tiger (Panthera tigris), the leopard (Panthera pardus) and the Indian wild dog or dhole, (Cuon alpinus).9
In carnivores, urine and scat communicate social information between individuals of both the same species as well as different species. Scat contains undigested prey remains such as hair, bones, feathers and scales, which can be used to identify the prey taxa and in some cases even species consumed. The scat samples and their area of deposition differ among different species to a certain extent. After collecting 673 scat samples across all three species, Karanth and colleagues identified and quantified the prey species in each scat using micro- and macroscopic features of the hair found. The hair samples of prey animals were compared with a reference hair sample, allowing them to identify species.
The researchers found that on average, both tiger and leopard diets consisted of approximately eight vertebrate species. Although a substantial overlap in the species of prey was observed between these two carnivores, tigers’ diet was comprised of mostly larger body-sized animals, while leopards ate mostly smaller to medium-sized animals. For example, tigers more often consumed the adults (weighing more than 200 kg) of two species: the gaur (Indian wild buffalo) and sambhar deer (large deer). On the other hand, leopards preyed upon younger animals (weighing less than 100 kg). The scat analysis suggested that niche partitioning with respect to prey body size and diet choice had enabled two very similar felid species to coexist, highlighting the role of large-bodied prey in the maintenance of the tiger population of that region.
Dhole diet also overlapped with that of leopards, ranging from small to medium-sized prey. Although dholes are smaller than leopards, they are group-living canids that capture their prey by continuously chasing them to tire them down, also called pursuit hunting. This feature enables them to hunt prey similar in size to that of leopards, which are solitary animals that follow sit and wait strategy, also called ambush hunting.
- intraguild
- Within a guild.
- camera traps
- Hidden, motion-detecting cameras that automatically click pictures when animals cross in front of them. Scientists use the camera trap images to collect data on the presence and absence of species of interest.
In another study, Hemanta Kafley and colleagues took a very different approach. They attempted to study the same intraguild interaction using camera traps. They used sophisticated statistical and computational tools to understand the coexistence of tigers and leopards and how their distribution and interaction is affected by human disturbance.10 Although the full details of the techniques are beyond the scope of this book, we will try to understand how they carried out the study and what they found.
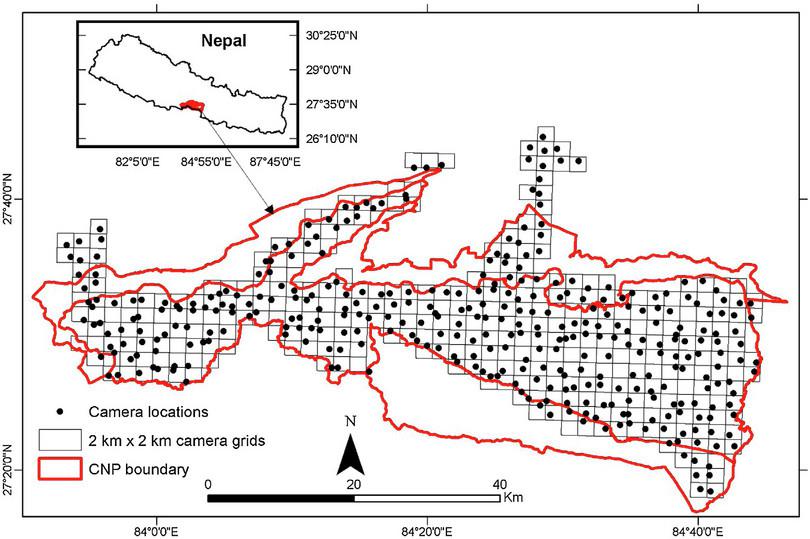
Figure D1.5a A digital map of Kafley et al.’s study area, Chitwan National Park, Nepal, divided into quadrats, where paired camera traps were set up.
Kafley, H et al., ‘Tiger and Leopard Co-occurrence: Intraguild Interactions in Response to Human and Livestock Disturbance’, Basic and Applied Ecology 40 (2019): 78–89, doi: 10.1016/j.baae.2019.07.007.
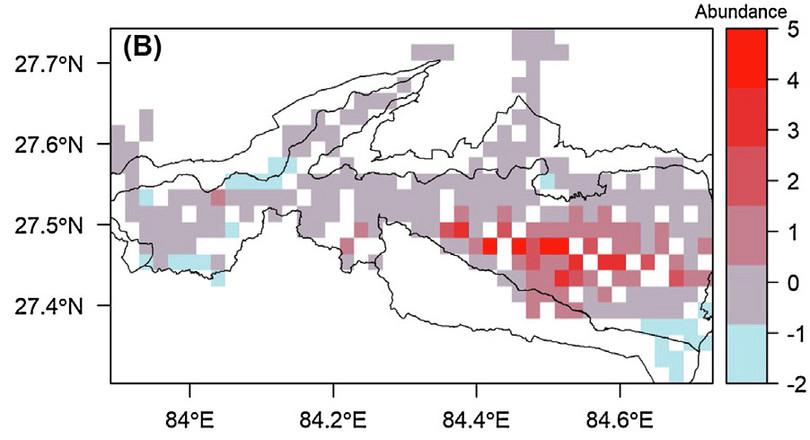
Figure D1.5b A GIS map showing the abundance of all prey species, predator species, and human disturbance.
Kafley, H et al., ‘Tiger and Leopard Co-Occurrence: Intraguild Interactions in Response to Human and Livestock Disturbance’, Basic and Applied Ecology 40 (1 September 2019), accessed doi: 10.1016/j.baae.2019.07.007.
Conditional probability is defined as the likelihood of an event or outcome occurring, based on the occurrence of another previous outcome.
- quadrats
- Randomly chosen plots of habitat, usually sqaure in shape, used as samples to study plant or animal life. A quadrat can also refer to the frame or tool that is used to mark out the chosen area.
- regression model
- A statistical model used for quantitative analyses. A regression model first presents the relationship between dependent and independent variables, in which the independent variable is hypothesised to have a measurable effect on the dependent variable. With the help of relevant datasets for the chosen variables, the regression analysis allows us to determine the strength and character of the relationship between these variables. See also: hypothesis.
- Kafley and his team surveyed 361 natural areas in Chitwan National Park in Nepal (close to the Indo-Nepal border). They divided the study site into 2 × 2 km quadrats (on a map) and set up camera traps in these quadrats (Figure D1.5a).
- They left one or two camera traps in each of these quadrats for 17 days and allowed them to record photographic evidence of animals visiting the sites.
- They collected photographic evidence of prey species (chital deer, sambar and livestock), and predator species (tiger and leopard), along with evidence of human interference (Figure D1.5b).
- The location of each camera trap was recorded using a geographic positioning system (or GPS), which they incorporated into the map (Figure D1.6a).
- After collecting data, they divided the total quadrats into three categories, namely areas inhabited by a) only tigers, b) only leopards, and c) both the species.
- For each quadrat they collected information on the presence (1) or absence (0) of a species, which they summed over the 17 days to get data on the abundance (number of counts) of a particular species.
- They used their data from the camera trap images to calculate the probability of detecting a tiger and the probability of detecting a leopard, given the conditional probability that the tiger is present or absent in the same quadrat. From this they generated occupancy models (using a simplistic regression model) of each of the predator combinations: tiger, leopard, and both.
- interference competition
- A type of direct competition between organisms for resources, goods, or mates, that may display aggression.
Kafley and the team’s results were very interesting. They found robust evidence that the species directly compete with each other (also called interference competition) from their analysis. There was a significant overlap in the diet of the two predator species (a guild), indicating that they competed for resources. However, the smaller leopards often lost the competition and might have even been killed by a tiger.
They showed that prey abundance strongly determines the abundance of tigers. In contrast, leopard abundance is low in areas where tigers are present, suggesting that leopards live along the fringes of tiger territories to avoid competition and the risk of being killed by tigers. On the other hand, leopards were more abundant where human interference and livestock population were high. This study demonstrated that niche partitioning happens between two competing species, but human interference might facilitate the coexistence of the predators.
Extra reading Regression models
Regression models are statistical models used to estimate the strength of the relationship between two variables. Often one of the variables is the predictor or independent variable (also called the covariate) that determines the outcome of a dependent (outcome or response) variable. Linear regression is the simplest form of regression analysis, where one tries to fit the spread of data to the closest possible linear relationship. For example, the prey abundance (independent variable) is positively related to predator abundance (dependent variable). Predator abundance may likewise determine prey abundance. Hence, although the two variables are strongly and positively correlated, we cannot say which variable causes the other to vary. The figure below shows that, in natural systems, it is not only prey abundance that determines predator abundance, but also vice versa (see Figure C1.11).

Hypothetical diagram showing the linear relationship between an independent variable (x-axis) and a dependent variable (y-axis). The red dots are the spread of the data and the red straight line is the best fit line that minimises the mean spread (deviation) of the data from the line.
Summary
In this section we attempted to understand how intra-species and inter-species competition works in nature using certain theories. In large animals, it has been shown that maintaining territorial boundaries with scent marking is a prominent way to avoid within-species competition. Further, we studied how two species of big cats can coexist by partitioning their niches. This section also looked at some practical aspects of how to study species coexistence between two similar-sized carnivore species (two-way species interaction). In addition, we explored the different scientific techniques such as electronic devices and analytical tools that scientists use to conduct such research.
D1.4 Cats are rare and elusive: population estimation of felids
Scientific tools Quantitative skills Bridging science, society and the environment
Since cats are solitary and elusive, it brings up the question of how researchers can establish the number of cats in an area. We define a population as the number of individuals or organisms of a species within a geographical area that are capable of interbreeding. Counting the number of solitary (and elusive) individuals in a population is an enormous effort. Choosing whether to count each individual in a population or to estimate the population depends on the natural history of the species and the question that the researcher is asking. Technological advances in this field have made both approaches achievable.
Population counts and population estimates
In wildlife populations, particularly in felids, scientists have used several different ways to estimate the population density of a species through sampling. Here we will explore a few.
Once a researcher decides to study the population size of an animal, there are a few aspects to take into consideration:
- the natural history of the species (what does it look like, where does it live, is it diurnal or nocturnal, is it solitary or group-living?)
- the spatial extent of the study area and the duration of the project
- the ecosystem and habitat characteristics (vegetation type) the animal lives in
- budget constraints of the project.
Therefore, there are at least two essential steps that a researcher needs to take:
- Identify individual organisms under field conditions.
- Using that data to estimate population size or density in an area.
Individual level identification
The ability to distinguish and identify individuals is essential for behavioural studies and population estimation of animals. The methodological challenges for this step are therefore unavoidable. Here we discuss a few common methods that are used for individual identification of animals.
Camera trap
Camera traps are very useful devices, particularly for elusive felid species that are nocturnal and found in large areas, which are difficult and/or inaccessible for sampling. Camera traps are currently used for several purposes, such as making documentaries, recording animal behaviour, or documenting different species visiting an area. However, determining the actual presence of an organism during surveys and identifying individuals to estimate the population count is one of the prime uses of camera traps.
A modern camera trap, shown in Figure D1.6a, is simply a digital camera that uses an infrared sensor to record an image when it detects a warm object. Individual identification is made using the image analysis performed post-recording (Figure D1.6b). Camera traps are therefore more suitable for felids and other species that have patterns on their body, based on which individuals can be identified.

Figure D1.6a A typical camera trap used to record animals that pass the infrared sensor in the front.
CIFOR, Flickr, CC-BY-NC-ND 2.0.
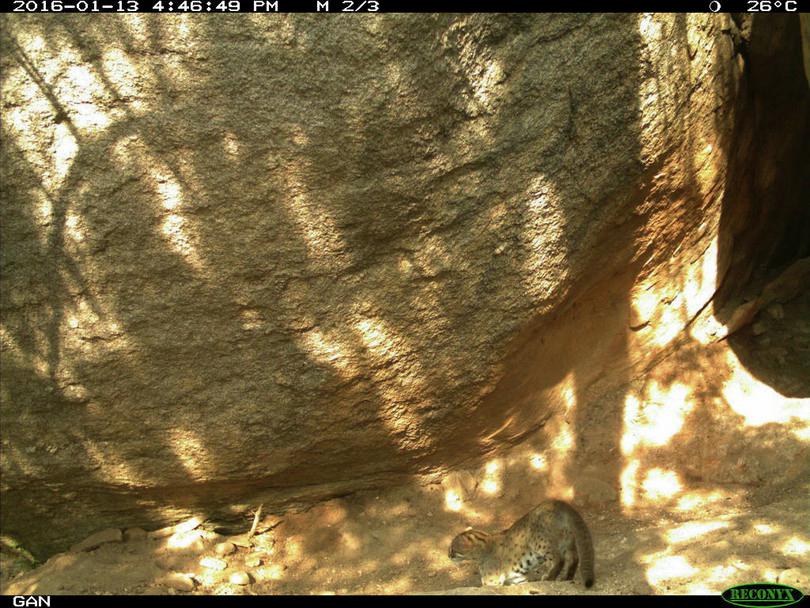
Figure D1.6b A picture captured with camera trap showing the smallest and most elusive nocturnal felid, the rusty-spotted cat.
Kaustubh Rau, iNaturalist, CC-BY-NC 4.0.
Camera traps have been widely used across species of larger and smaller cats in different landscapes in India. Ullas Karanth of the Wildlife Conservation Society used camera traps to estimate the populations of tigers. Based on indirect evidence of faecal droppings or scratch marks, a researcher identifies areas frequently visited by the animal and carefully selects sites to set up the camera traps.11 Karanth used the camera traps for a total of 387 trap nights in different locations in Nagarahole National Park over 12 months. Even then, after such intense effort, he could use only 31 pictures of good quality, where tiger identification could be undoubtedly confirmed. This shows the amount of work and patience involved in this scientific process.
Budget constraints become important when a device such as a camera trap is crucial for scientific study. The price of a camera trap ranges from 5 000 to almost 50 000 rupees, depending on the equipment quality. This makes it prohibitively expensive for an individual researcher.
In such cases, a research scientist usually collaborates with government officials and assists them by providing scientific advice. These are often Indian forest officials working in national parks or tiger reserves. Equipment costs are then borne by the government. Also, several different species are often caught on camera traps, providing opportunities for inter-organisational collaborations.
Whisker-spot patterns
Whisker-spot patterns allow identification when an animal lacks markings that aid identification. Early researchers spent long hours following an animal with a spotting scope (a larger binocular) to meticulously draw its whisker spot pattern. Figure D1.7a shows a whisker-pattern record for a lion. The first row of spots has two whisker spots, while the second row has two lines, one with three spots (left) and another with two spots (right) together. Each individual has a unique pattern of rows and gaps in their whisker spots used for identification purposes. Compared with Figure D1.7b, the two lionesses have very different whisker patterns from each other and from the lioness in the first photograph. A recently developed photographic technique converts the whisker spots to a pattern with reference to the distance from nose to eye and mouth, which is then used for identification reference (Figure D1.7c).

Figure D1.7 Identification of individual animals using the whisker-spot patterns of lions and Australian sea lions.
a. and b. Connie Lemperle.
c. Adapted from Osterrieder, SK et al., ‘Whisker Spot Patterns: A Noninvasive Method of Individual Identification of Australian Sea Lions (Neophoca Cinerea)’, Journal of Mammalogy 96, no. 5 (2015): 988–997, doi: 10.1093/jmammal/gyv102.


Adapted from Osterrieder, SK, Kent, CS, Anderson, CJR, Parnum, IM and Robinson, RW, ‘Whisker Spot Patterns: A Noninvasive Method of Individual Identification of Australian Sea Lions (Neophoca Cinerea)’, Journal of Mammalogy 96, no. 5 (2015): 988–997, doi: 10.1093/jmammal/gyv102.
Pugmark technique
The pugmark technique has been used particularly for carrying out a tiger census in India and for a few other larger felids in the world. Derived from the Hindi word ‘pug’, a pugmark means an impression of a footprint of an animal. The technique was introduced by an Indian forester, Saroj Raj Chowdury from Orissa, in 1972, and became popular throughout India and other countries.
When a tiger (or any other animal) crosses a landscape, its footprint remains visible for a while on the substrate. Weather conditions and the quality of the substrate determine how long and how well a pugmark will remain visible. For example, a semi-moist to semi-arid soil with a sand-mixed soil might give a precise tiger footprint (Figure D1.8a), while one in extremely moist regions might be different (Figure D1.8b). Under field conditions, identifying pugmarks and tracing them requires skill and practice.
The pugmark technique is simple and cost-effective, but also controversial. Its successful use depends on a good understanding of the physical features of the landscape and the animal. When a researcher identifies a pugmark, she fixes a glass slab on top of it. She traces the pugmark by hand (in some cases, plaster casts are used), which she then transfers onto paper and the individual tiger is identified based on qualitative and quantitative comparisons of the figures.
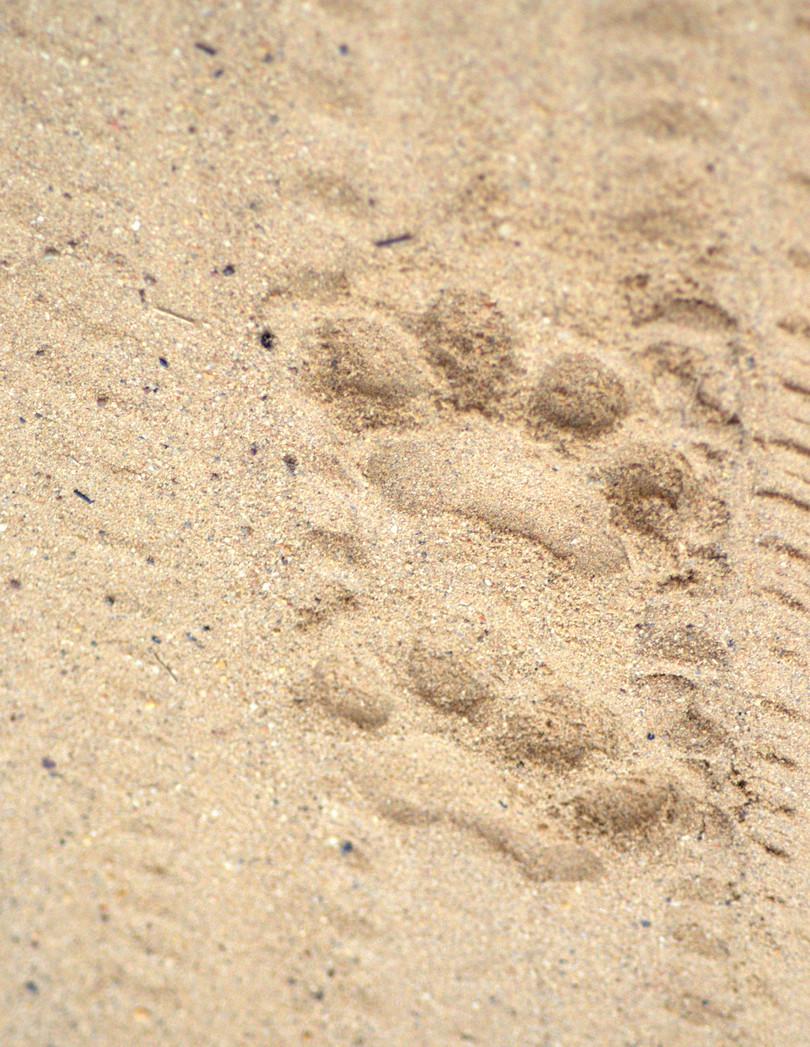
Figure D1.8a A fine impression of a left hind pugmark from dry, sand-based soil substrate.
Siddharthsinh Jadeja, Wikimedia Commons, CC BY-SA 4.0.
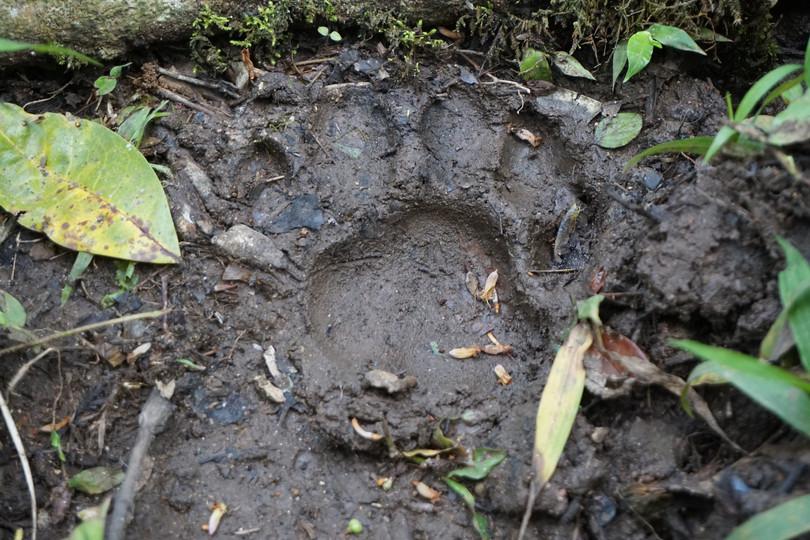
Figure D1.8b A right front pugmark on a damp, clayey substrate.
Arun Kumar T, Flickr, CC BY-SA 2.0.
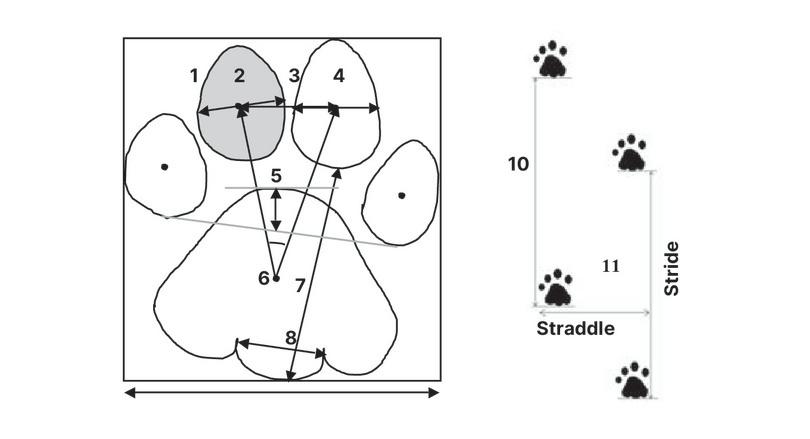
Figure D1.8c The final 11 variables that the scientist uses for pugmark identification, shown on a left front pugmark.
Sharma, S, Jhala, Y and Sawarkar, VB, ‘Identification of Individual Tigers (Panthera Tigris) from their Pugmarks’, Journal of Zoology 267, no. 1 (2005): 9–18, doi: 10.1017/S0952836905007119.
- discriminant function analysis
- A method used in statistics to predict membership in naturally occurring groups, in which the independent variable is a continuous variable and the dependent variable is a categorical group.
Recently a research team developed a quantitative approach to individual tiger identification using the pugmark technique. Sandeep Sharma and team12 from the Wildlife Institute of India (Dehradun, Uttarakhand) used tracings and photographs of 23 pugmark sets from 19 tigers (17 from the wild and 2 from captivity) and performed a stepwise analysis to identify an individual tiger using a statistical technique known as discriminant function analysis. Discriminant function analysis is complex, so let us try to understand the essence of the process involved.
Exercise D1.3 Measurements of a pugmark
Scientific toolsUsing Figure D1.8c, make a list of the 11 variables used for pugmark identification and state what each variable measures.
When a picture of a pugmark is transcribed into a computer program for identification, it automatically generates many measurements, similar to face recognition software. Sharma et al. generated 93 variables from a single tiger pugmark.
As a second step, we might realise that 10 measurements (for the face) and 93 measurements (for the pugmark) might be excessive. So one would group the variables into different classes. For example, if the length of the eye and the width of the eye are strongly correlated, we can just take one measurement of the eye and similarly, one measurement of eyebrow, one from lips, and one from the nose. Sharma et al. selected 11 groups of measurements that would best justify whether tiger 1 was different from tiger 2 (Figure D1. 8c).
As a third step, Sharma and team further sub-grouped these 11 variables and arrived at a few combinations of variables (instead of individual variables) which they ranked. Let us try to simplify this with the example of face recognition. If the eye and eyebrow combination of your face best explains your identity, while the nose and the lips are the second best, these two combinations will be used to identify a face and to best discriminate it from someone else’s face. Sharma et al. used the same technique to discriminate tiger 1 from tiger 2, enabling the computer software to generate individual identities of tigers.
There are a few other ways researchers have tried to identify individuals.
- Genetic analysis: The researcher collects scat samples while systematically walking (sampling) transects through habitats of an animal. The scat samples can then be analysed using DNA fingerprinting techniques (similar to DNA fingerprinting for rice) which use microsatellite markers (a type of genetic marker). Scats contain epithelial tissue from the subject animal which enable individual identification. Hair samples and diet choice also enable researchers to confirm the species that left the scat.
- Global positioning system (GPS) techniques: These involve researchers fitting GPS collars onto individuals, which helps them identify the individuals and monitor them regularly. As with camera traps, this is a very costly technique.
Estimating population density
After individual-level identification, a researcher needs to estimate the population density. In this section, we go through a basic index used for population estimation, to understand the procedure.
- mark-recapture method
- A wildlife survey method used to estimate the size of a local population through multiple sampling schemes.
Estimates of censuses can be grossly inaccurate, primarily because one rarely sees all the individuals of a population in a given area. The mark-recapture method is often used to estimate wild animal populations, especially when conducting censuses is unfeasible. The technique is as follows:
- On the first sampling event, we see an individual and tag or mark it (photographic evidence is one of the most common ways to do that). This is a mark.
- On the second day, if we see the same individual again, that is a recapture and not a mark, while other new individuals (from the second day) will be marked.
Mark-recapture enables us to estimate the probability of detection (p) that tells us what percentage of the population we are capturing or detecting through sampling. Once this is known, we can easily estimate the percentage of the population that is not being detected to calculate the total abundance. The simplest index to analyse mark-recapture data is the Lincoln-Petersen index that uses only two sampling sessions. Let’s say that:
- M – individuals marked on the first session
- N – total population (to be estimated)
- R – number of marked individuals recaptured in the second sampling session
- C – total number of individuals captured in the second session.
With this information, we can calculate:
\({M \over N} = {R \over C}\) or \(N = {(M \times C)\over R}\)
Here, capture probability is \(p = {R \over C}\)
Then, \(N = {M \over p} = {(C \times M) \over R}\), which is the estimate of the population within the area sampled.
While population counts or estimates are essential, it is important to monitor trends in population sizes over time. Monitoring detects unexpected changes in the population that might inform management decisions for effective conservation choices. For example, a study conducted by Priya Singh and David MacDonald estimated a density of five individuals of the rare marbled cat in 100 km2 in Dampa Tiger Reserve in Mizoram.13 This study provided the first density estimates produced from continental southeast Asia for marbled cats. Such a study can be significant for ecosystems such as the one found in Dampa, which have seen dwindling numbers of large predators in recent times.
Exercise D1.4 The mark-recapture method
Scientific toolsQuantitative skillsSimulate a mark-recapture estimate in groups within your class or study circle. Since we can’t use wild animals for this exercise, let’s work with household items. We will work with raw moong (Vigna radiata)* and moth (or matki, Vigna aconitifolia)* beans. The moong will represent unmarked individuals, and the moth will represent marked individuals of the same species. You will also need three cups to put the beans in. These will represent your populations. Below is a datasheet that your group can use to record your data.

![Mark-recapture method.]()
Mark-recapture method.
Requirements
- ~70 moong beans
- ~30 moth or matki beans
- three cups
- datasheet (sample below)
*Note that you can use two differently-coloured beads instead of these beans.
Activity
We will put a total of 30 beans in each cup:
- 1st cup – add 3 moth beans and 27 moong beans
- 2nd cup – add 10 moth beans and 20 moong beans
- 3rd cup – add 15 moth beans and 15 moong beans
Without looking inside the cup, randomly select 3 beans from the first cup, 10 beans from the second cup, and 15 beans from the third cup. This is your second sampling. Count how many of each sample are moth beans (or marked individuals). These are your recaptured, marked individuals. Add this data to your datasheet, and then calculate population estimates for each cup.
Formula for population estimation, where M is the number from the first sample, C is the number from the second sample and R is the number of marked individuals recaptured in the second session:
\[N = {(M \times C)\over R}\]
Population No. of individuals observed and marked on first sampling (M) No. of individuals observed on second sampling (C) No. of marked individuals recaptured (R) Population estimate (N) Cup 1 3 3 Cup 2 10 10 Cup 3 15 15
- Which population estimate was the closest to the actual population size?
- Why do you think the population you named in question 1 has the closest estimate?
- Why do you think we’ve kept the sample size for both sampling schemes the same (i.e. M = C)? What happens when you change C?
- Try this same exercise with a larger population size (50 beans, 100 beans). Remember to also increase your sample sizes. Now test which population estimate comes closest to the actual number.
- Do you think this is a good technique to estimate population size of wild animals? Why or why not? What are some drawbacks?
Summary
To understand how populations of carnivore species are counted or estimated, in this section we looked at different techniques available to identify individual animals and the standard methods that conservation practitioners follow to use these identities to estimate the population of an animal. We also delved into recent technologies and statistical techniques involved in individual identification and population estimation. Through an exercise, we have explored the processes involved in estimating and monitoring populations. Further, we have attempted to bring forth some of the challenges faced by wildlife researchers in conducting such population surveys and analyses.
D1.5 Doing science with the help of citizens: does citizen science always work?
Reading and interpreting Bridging science, society and the environment
‘Citizen science? What is it? Can I participate?’ are questions you may have thought of when you first heard this term. Citizens collaborating with professional scientists can enhance the scope and quality of scientific research and the ability to collect scientific data. The idea of citizen science emerged from engaging citizens to participate in scientific research, where scientists benefit because they have more people to collect data, and citizens benefit from the experience. The citizen science approach is becoming increasingly popular among citizens and scientists. In India, projects like the Biodiversity Atlas, ebird-India, Butterflies of India, and Citizen Sparrow encourage and involve citizens across age groups from enthusiastic school children to retired professionals. Scientists gather data collected by citizens, and analyse and synthesise it to write scientific papers.14
What are the benefits of citizen science for scientists? They must invest a great deal of time and effort to train citizens to collect reliable data. The benefits relate to financial constraints. Collecting data on an extensive scale or range (for example ethnic groups, ecosystems, or inaccessible regions) is expensive. Mass-volunteered citizen-science projects are a solution.
Proper training of volunteers to conduct citizen science projects is vital because inadequately-trained citizens may not collect reliable data. Unreliable data must be discarded.
The Audubon Society (USA) undertook one of the earliest citizen science project initiatives for their annual Christmas Bird Count. (The Audubon Society is a non-profit organisation in America founded in 1905 and dedicated to the conservation of birds and their habitat). Since then, successful citizen science projects have contributed data from astronomy to bird counts worldwide. In this section, we examine a successful and a not-so-successful citizen science project, both related to studies of felids.
A successful citizen science project
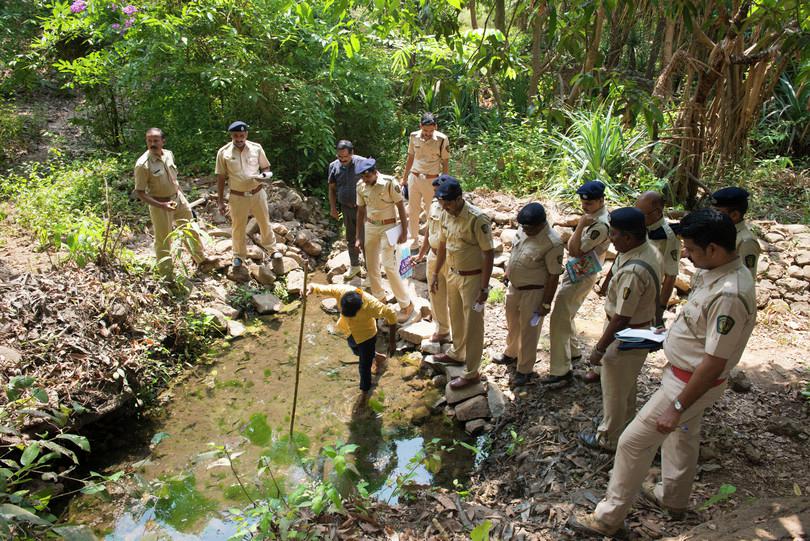
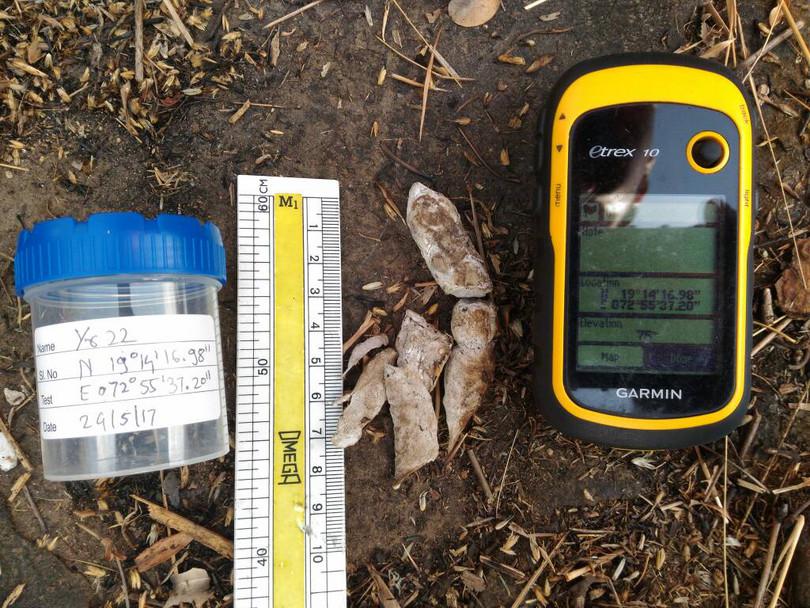
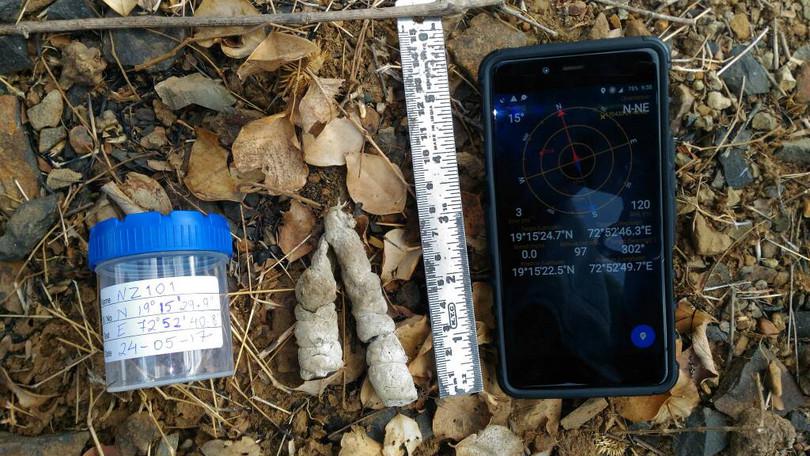
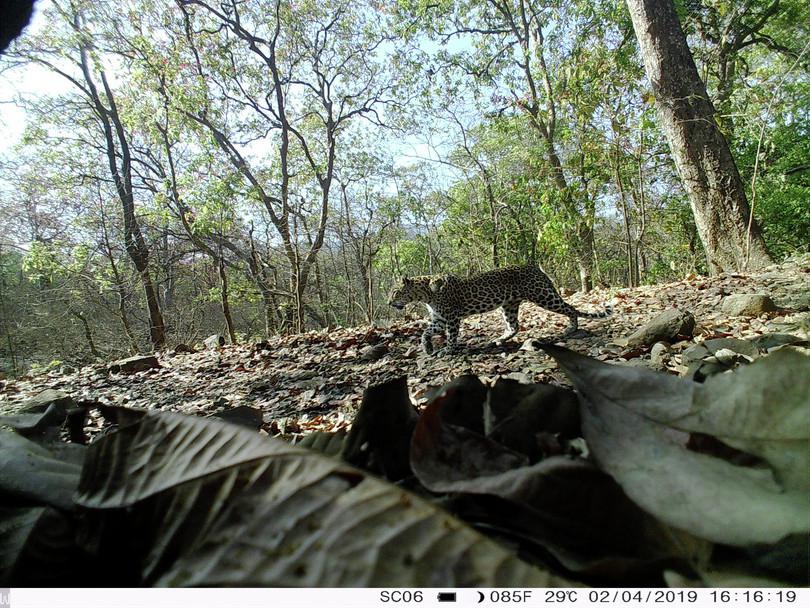
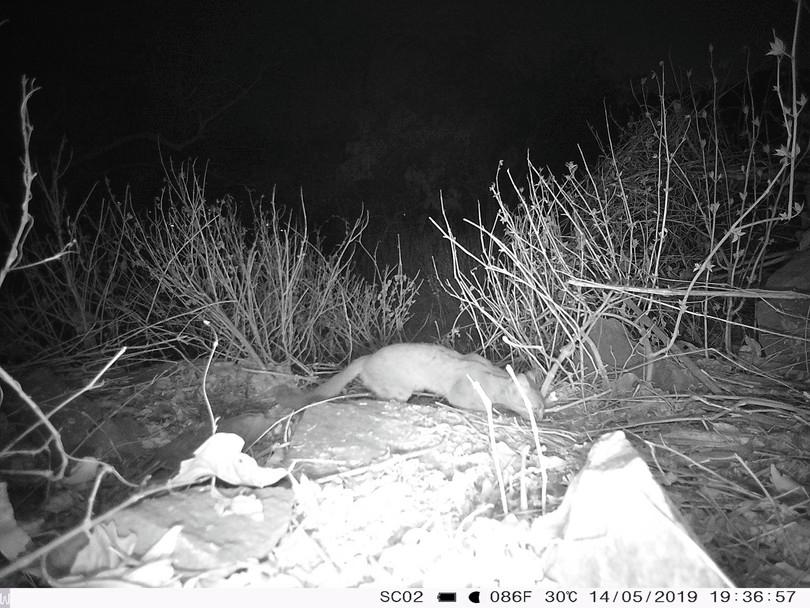
Efficient training and the use of robust protocols can lead to a successful citizen science project that can contribute to science and the conservation of species. Shomita Mukherjee (Salim Ali Center for Ornithology and Natural History, SACON, Coimbatore, Tamil Nadu) led a team including 35 citizen volunteers that conducted a population survey of small-cat species in the Sanjay Gandhi National Park (Mumbai).15 During this study, volunteers were trained to use camera traps, GPS (or handheld global positioning systems) devices, and collect carnivore scat samples from the field for genetic analysis to identify individuals (Figure D1.9).

Through this project, Mukherjee and her team were able to generate data of small-cat species and their abundance in the area. Their results gave the park managers an estimate of the diversity and distribution of the small cats in the park. Such information is crucial for park managers to make management decisions for species, particularly for those that are declining. The team concluded that citizen-volunteer participation in the data collection process can be a fruitful venture but requires ample time, training, and continued supervision.
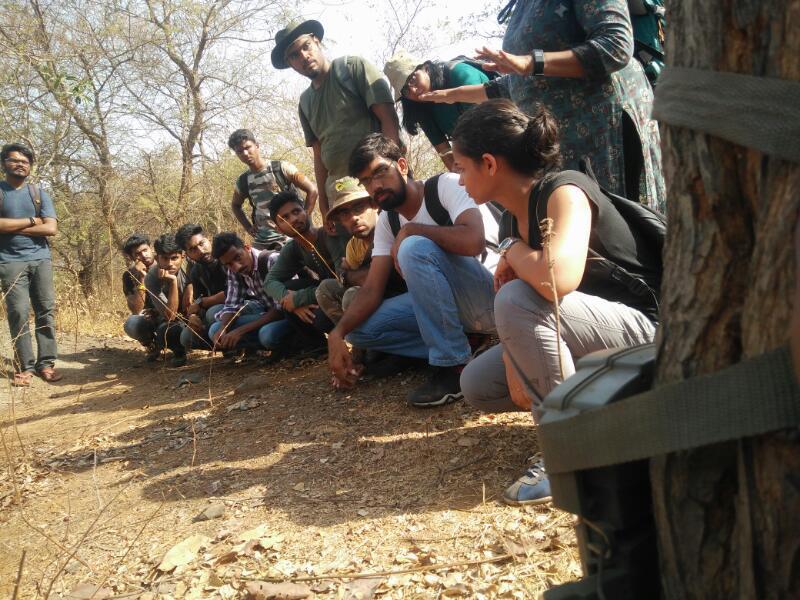
Figure D1.9 Photos from the Sanjay Gandhi National Park-SACON Small Cat project.
a. and b. Nayan Khanolkar.
c., d., e. and f. SGNP-SACON Small Cat project.
Nayan Khanolkar.
Nayan Khanolkar.
SGNP-SACON Small Cat project
SGNP-SACON Small Cat project
SGNP-SACON Small Cat project
SGNP-SACON Small Cat project
A less successful citizen science project
Another large-scale project involving citizens failed to accomplish satisfactory results. Since 1966, the Government of India has been undertaking a large-scale citizen science project to count the tiger population in the wild. Forest officials would gather thousands of volunteers who would fan out across the national parks and reserves in India within a one to two week period to collect the imprints of tiger pugmarks, helping them to conduct a tiger census in the country. The volunteers were expected to identify tiger pugmarks and obtain a plaster cast or tracing of the left hindfoot without distortion (Figure D1.10), after covering large areas of tiger habitats.
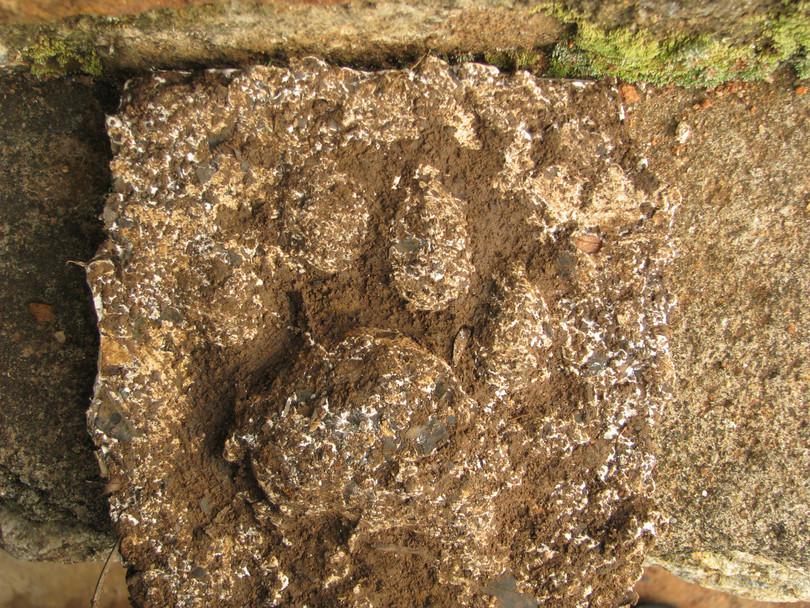
Figure D1.10a An example of a tiger pugmark plaster cast.
Seshadri KS.
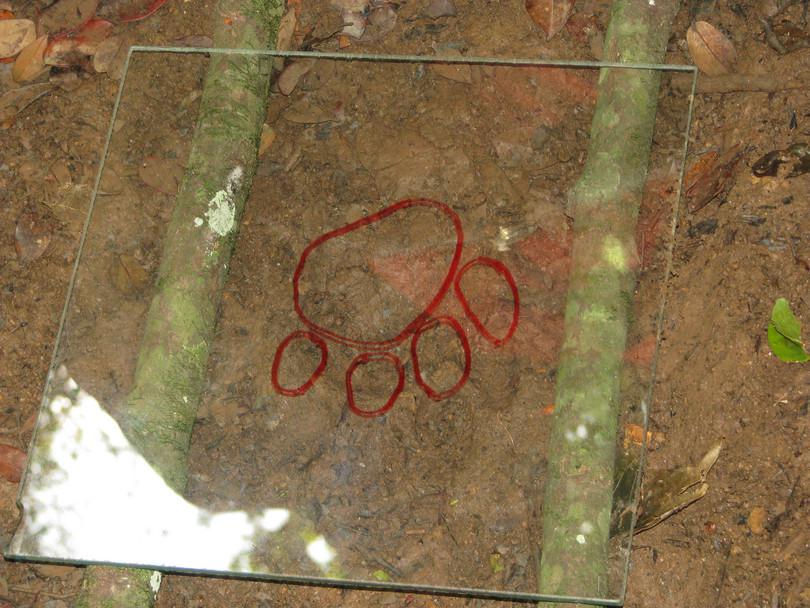
Figure D1.10b A method of tracing a pugmark using a piece of glass. This method of tracing is not known to be the most reliable owing to the inconsistency in the quality of tracing that is done by hand.
Seshadri KS.
It proved extremely difficult to cover a large tiger habitat (>300 000 km2) in a few days. Also, owing to the complexity and variability of the soil substrate, the probability of finding and accurately tracing tiger tracks was very low and highly variable across subjects.16 17 Consistency proved elusive in such a large project. This generated unreliable data making it difficult for managers to implement conservation measures.18 Despite these challenges, scientists have rebooted the census techniques using more sophisticated statistical analysis and cameras where photographic evidence is collected, instead of tracing.
Summary
This section introduces the basics of population ecology, enabling us to identify the differences between population census and population estimates. We explored a variety of analytical tools and techniques that a scientific researcher uses to understand populations of rare and elusive species. We also looked at tools and techniques that are currently used in India to study large mammal populations and analysed their strengths and drawbacks. We also discussed how citizens can assist with collecting large (area, species) datasets, and how efficient training and supervision of volunteers can make such citizen-driven projects a success.
D1.6 Why conserve? Human–wildlife conflict and cooperation
Reading and interpreting Bridging science, society and the environment
A country’s natural resources, including its plants, animals, soil, minerals, water and air, are treasures that a citizen should take pride in. In a felid-diverse country with 15 magnificent and beautiful wildcats, losing any one of these cats would be “like losing a front tooth – it will never be the same again”, as the popular saying goes. Undoubtedly, the aesthetic value of wildcats deserves conservation attention. More importantly, wildcats play a crucial role as predators in their ecosystems. Many of the larger felids such as leopards and tigers are apex predators that control the abundance of all populations lower down the food chain.
Recent land-use changes and the destruction and pollution of natural habitats to meet the demands of the human population have threatened all habitats. Although these habitat alterations have impacted species regardless of their size, most conservation attention has focused on larger mammals, and more narrowly, on predators. For example, in this chapter, you might have noticed that most examples pertain to larger predators: tigers, leopards, and lions; while smaller cats have been ignored. The reason is the lack of studies and a dearth of information on smaller cats, but this trend is slowly changing (Figure D1.11).
In this section, we are going to look at two case studies:
- How habitat alterations might have impacted the habitat and foraging grounds of a cat species (human–wildlife conflict).
- How predators can harmoniously coexist with humans (human–wildlife cooperation).
Before proceeding, we will revise a few known facts in conservation.
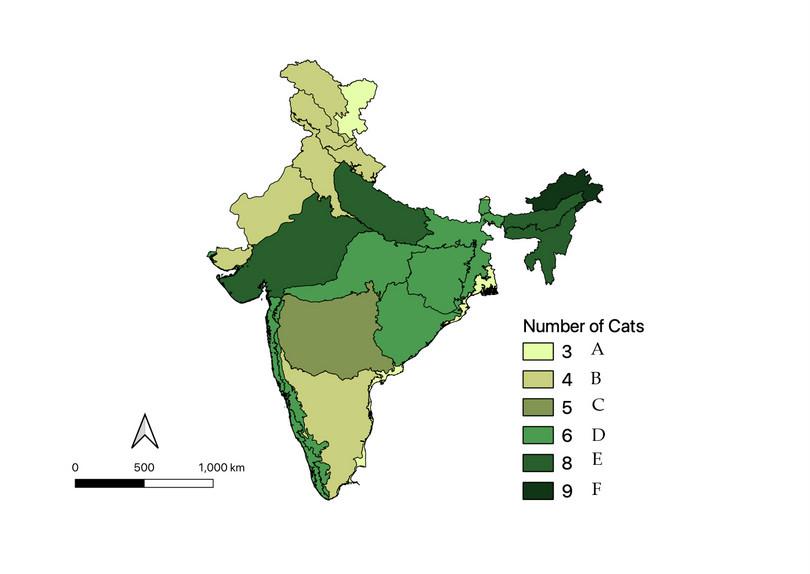
Figure D1.11 Distribution of cat species in India across biotic provinces (A–F), where: A – parts of the Tibetan plateau, parts of eastern coasts, and Sikkim trans-Himalaya; B – Kachchh desert, Deccan peninsula, west to north-west Himalaya, Ladakh, Punjab plains; C – Deccan peninsula, central plateau; D – parts of Deccan peninsula, upper Gangetic plains, Western Ghats, parts of eastern coastline; E – north-east hills to Brahmaputra valley, lower Gangetic plains, and semi-arid Gujarat Rajputana; F – east Himalaya.
Distribution of cats in India (Mukherjee 2021, unpublished) overlaid on a biotic provinces map (Rodgers and Panwar 1988 and Rodgers et al. 2002).
- conservation
- The study of the Earth’s biodiversity losses, such as species extinction and loss of genetic diversity. Conservation also involves enquiry into the causes of such losses, as well as techniques of protection and restoration.
The Oxford dictionary defines conservation as ‘to protect from harm or destruction’, and ‘to prevent wasteful overuse of a resource’. Keeping the essence of both these definitions, conservation biologists have defined conservation as the adequate and efficient use and preservation of natural resources.19 In biology, conservation can be of species, habitat, ecosystem, or genetic diversity. In the context of species conservation and felids, conservation can be achieved in two ways.
- in-situ conservation
- Methods of conservation of flora and fauna within their natural environment, enabling biological diversity to maintain itself. For example, a wildlife sanctuary allows for the monitoring and management of a target species and its natural habitat.
In-situ conservation means protection or preservation of biodiversity or genetic diversity in its natural habitat (on-site). This generally happens in protected areas such as national parks, wildlife sanctuaries, biosphere reserves, sacred forests, and so on. In-situ conservation needs investments in management and monitoring.
- ex-situ conservation
- Methods of conservation of flora and fauna outside of their natural environment, through the relocation of a target species. Such methods of conservation are useful for the rescue and maintenance of threatened species.
On the other hand, ex-situ conservation is preserving biodiversity or genetic diversity outside its natural habitat. This can be achieved through seed banks, gene banks, long-term captive breeding programmes, zoos and botanical gardens, cryopreservation, and tissue culture labs. Ex-situ conservation involves investment in transferring animals or plants and maintaining a new location to manage and maintain the resources.20
In-situ methods of conservation are always advisable for larger mammals. Large mammals, especially predators, need large areas to survive and flourish. Hence, retaining them in captivity is detrimental to their health and wellbeing. However, most protected areas in India are too small to harbour a stable and resilient population of such animals. Several Indian researchers have been studying large and small cats, attempting to address conservation-related issues.

‘Connect to protect’: conservation of tigers in India
- metapopulations
- Regional groups of spatially exclusive populations of the same species that may or may not interact.
- wildlife corridors
- Areas of habitat, natural or artificially created, that connect other fragmented habitats, thereby facilitating natural processes such as migration and interbreeding of organisms.
- gene flow
- The transfer of genetic material or alleles from one population to another of the same species, thereby altering the allele frequency or genetic variability of the receiving population.
Trishna Dutta and a team of researchers took a different approach to conserve tigers.21 They have been working on the long-standing question of metapopulations and the importance of ‘connect to protect’ wildlife populations, emphasising connecting the metapopulations by establishing wildlife corridors. Dispersal and gene flow or genetic exchange between metapopulations increases the probability of species persistence.22
Extra reading Gene flow
Gene flow is the exchange of genetic material between discrete populations due to the movement of gametes, individuals, or groups of individuals from one place to another. Natural selection tends to adapt a population to the local environment, causing favourable alleles to increase in the population. Gene flow may constrain evolution because it brings non-adapted alleles into the population’s gene pool. It may prevent populations from evolving into different species. However, gene flow can also be a creative force in evolution. The movement of individuals and even entire populations may spread superior alleles and combinations of alleles throughout a species if they become common in one location.23
Central India, spreading across Madhya Pradesh, Maharashtra and Chhattisgarh, falls within the global priority landscape for tiger conservation.24 A total of 16 protected areas lie in this region, which is severely fragmented due to human-induced land-use changes towards agriculture and development (Figure D1.12a). For this study, the team used the GIS tool and identified three layers of data that might be relevant to develop a spatial statistical model. Imagine this as superimposing three layers on a map. The three layers were:
- land cover-land use
- transportation networks (roads and railways)
- human population density.
Using these combinations, they generated ‘least-cost corridors’ that provided the least resistance to tiger movement across the 16 protected areas (Figure D1.12b).
In a severely human-altered landscape, the team still found opportunities to connect the network of protected areas. They identified 35 paths or connections linking these areas. If these linking corridors are established and tigers move through them, the tiger population may increase and flourish in the protected areas. As a biology student, you will realise that this is much easier said than done. Although a scientist might recommend a conservation action, in reality, field conditions impose many challenges to implementing these actions, and there remains a large gap between science and practice.
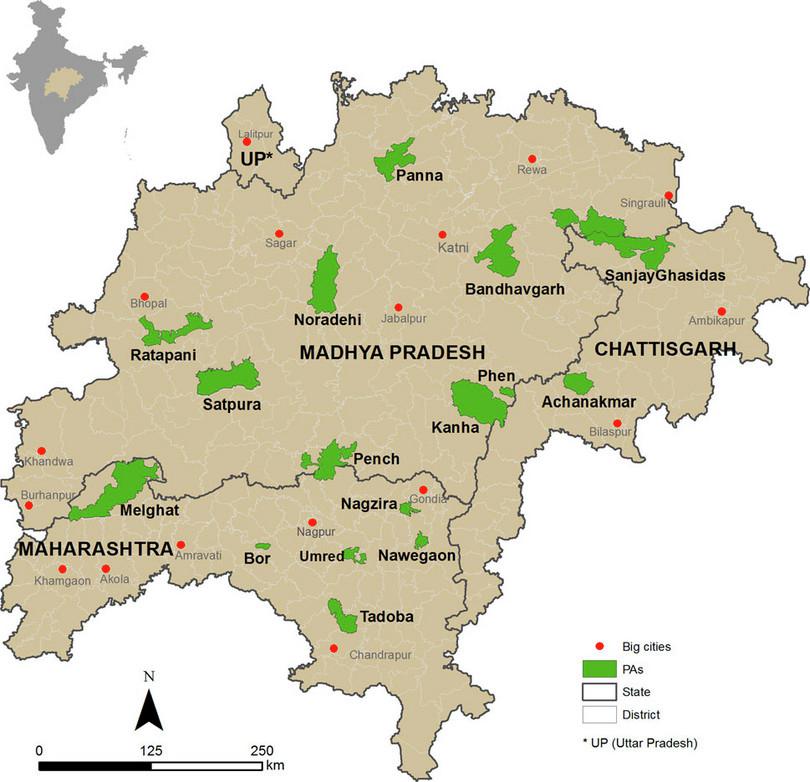
Figure D1.12a A central Indian landscape with 16 protected areas (in green), fragmented by agricultural and urban landscapes.
Dutta, T et al., ‘Connecting the Dots: Mapping Habitat Connectivity for Tigers in Central India’, Regional Environmental Change 16, no. 1 (2016): 53–67, doi: 10.1007/s10113-015-0877-z.
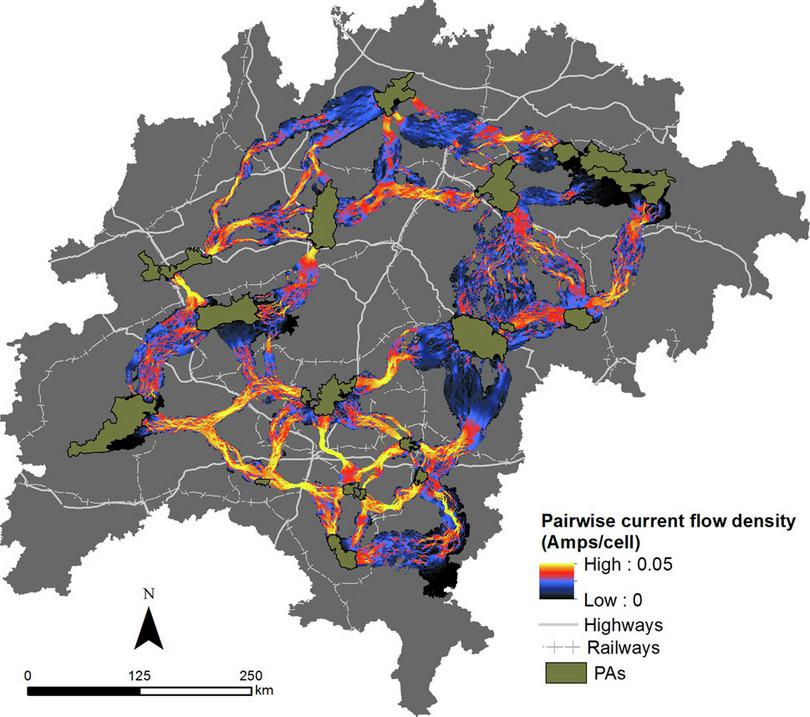
Figure D1.12b A network of 35 corridors linking the protected areas, as proposed by Dutta and team.
Dutta, T et al., ‘Connecting the Dots: Mapping Habitat Connectivity for Tigers in Central India’, Regional Environmental Change 16, no. 1 (2016): 53–67, doi: 10.1007/s10113-015-0877-z.
Case 1: Human–wildlife conflict
- human–wildlife conflicts
- The variety of interactions between people and wildlife species that result in negative outcomes for both or either parties, such as food insecurity and habitat disturbance.
Owing to unprecedented human encroachment into wild landscapes, it is critical to avoid human–wildlife conflicts. India has a growing economy, where the majority of the population is dependent on natural resources. Economic goals and conservation ideals often clash, with the former usually taking priority. Human–wildlife conflict arises firstly from crop damage by pest insects and secondly crop-raiding, property damage, and, most importantly, attacks on livestock and humans by large mammals such as elephants, tigers, leopards and wild pigs.25 Further, humans have exploited resources for their consumptive lives, including driving land-use changes that lead to habitat destruction.
- IUCN
- The abbreviation for International Union for Conservation of Nature, a global association formed by government and civil society organisations for the purpose of nature conservation and management across the world. IUCN holds an official observer status, granted by the United Nations General Assembly. See also: conservation.
Human–wildlife conflict is illustrated by the endangered fishing cat. Occurring in 11 countries, the fishing cat Prionailurus viverrinus is currently listed as a Schedule 1 animal of the Indian Wildlife Protection Act and as Endangered in the 2010 IUCN Red List of Threatened Species.26 As opposed to many cats that dislike water, fishing cats are uniquely a wetland species. Bigger than a jungle cat, yet smaller than a leopard, the fishing cat is a versatile hunter along India’s coastal and wetland regions.27 28 Fishing cats are nocturnal, and eat fish, snakes, crustaceans, frogs, small birds, rodents and even scavenge on the carcasses of large animals.
Fishing cats face major threats across their population range due to ecologically unbalanced land policies and land uses, direct persecution due to conflicts (overharvesting of fish, the most important food resource of these cats) and ritual hunts. In addition, many local people have started making profits from aquaculture. They dig ponds to grow fish and the cats conflict directly with fish farmers by stealing the fish. The conflict often ends badly for the cats. The population of fishing cats is dwindling rapidly, yet minimal conservation efforts are being directed towards this species.
The International Union for Conservation of Nature and Natural Resources (IUCN) was founded in 1948. Their main goal is the sustainable use and maintenance of natural resources. IUCN produces the Red List of animals and plants to provide information on the population status of wildlife, including categories of species that are extinct, locally extinct, endangered, vulnerable, and so on. The Convention on International Trade in Endangered Species (CITES) is a multilateral treaty to protect wild plants and animals. The Indian Wildlife Protection Act (1972) performs a similar function specifically for Indian wildlife.
Case 2: Human–wildlife cooperation
Throughout India, several unfortunate events (for wildlife and humans) have arisen owing to human–wildlife conflicts. The Government of India has devised several schemes for mitigating human–wildlife conflicts through compensation programmes. In this section, we will look at how compensation programmes in India might help increase tolerance towards wild animals and aid in human–wildlife coexistence.
Research highlight Living with lions
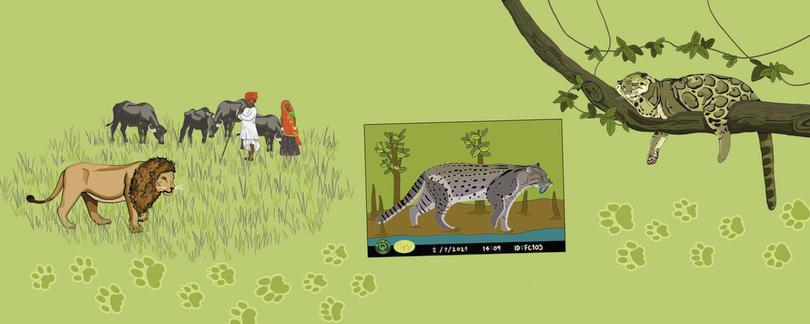
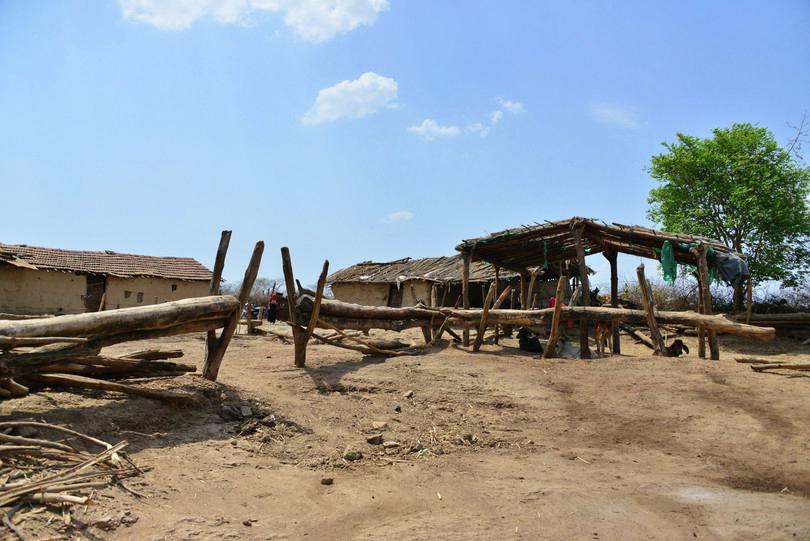
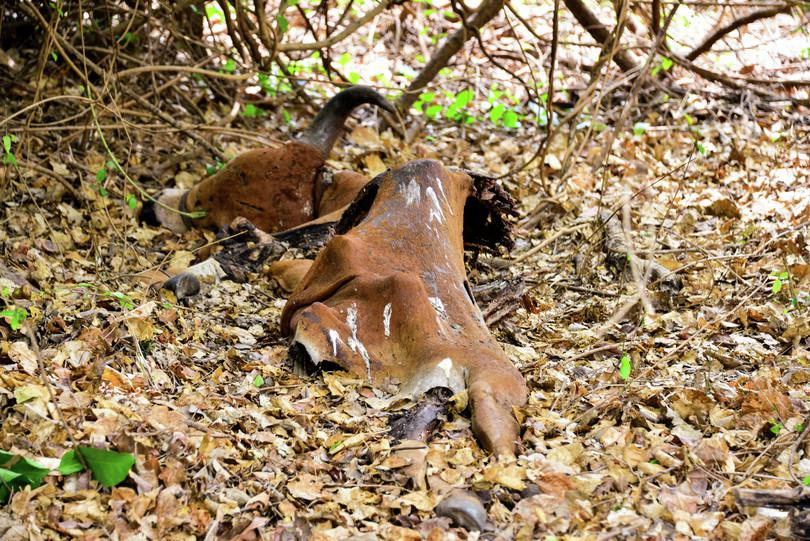
A research team led by Yadavendradev Jhala and Kaushik Banerjee examined the economics of coexistence between the only existing population of Asiatic lions and the indigenous pastoralist community in the Gir forest of Gujarat.29 Their study was based on the Maldhari (livestock holders) community which lives inside the forest buffer zone. The community often experiences human–wildlife conflicts, where their livestock is predated upon by lions (Figure D1.13).
As a solution, the Indian Government initiated a compensation scheme that has helped the community in many ways. Based on prior knowledge of the forest ecosystem and the pastoral community, researchers studied the population of lions in areas with and without the presence of the Maldharis and their livestock. They found that livestock comprised 25–42% of the lion’s diet, and the compensation scheme reduced the capital loss to this community by 64%. They suggest that this association might instigate tolerance instead of atrocities towards wildlife. You can read about the various approaches and methods the researchers employed to come to such a conclusion in this annotated paper.
DownloadDownload annotated paper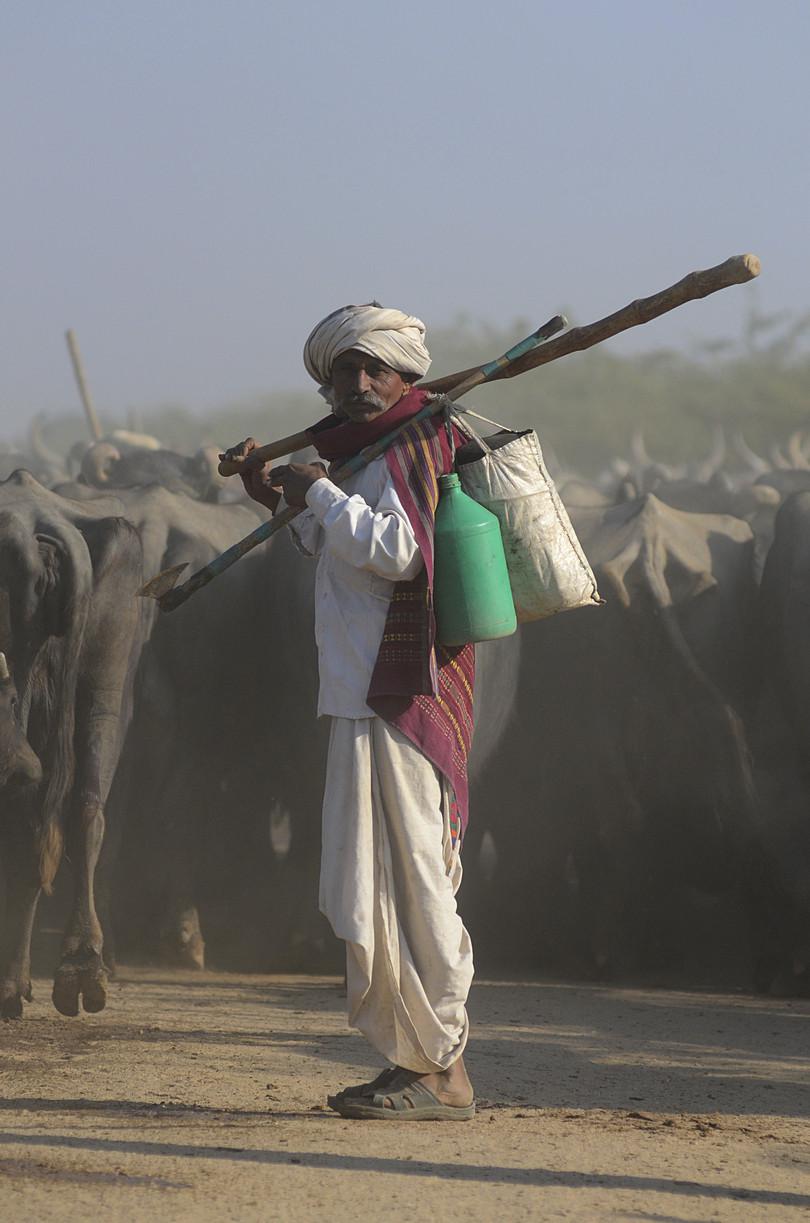
![Indigenous people and their cattle inside and around the Gir forests of India.]()
Figure D1.13a A Maldhari in typical attire with cattle on the road.
Copyright Lars Klausen Hald
![Indigenous people and their cattle inside and around the Gir forests of India.]()
Figure D1.13b A typical Maldhari ness (hut in the local language) inside the forest area. The front side of the ness is made into a cattle enclosure.
Copyright Tathya Macwan
![Indigenous people and their cattle inside and around the Gir forests of India.]()
Figure D1.13c A cow owned by a Maldhari that has been preyed upon by a lion, inside the Gir National Park.
Copyright Tathya Macwan
Summary
This section looked into some basic concepts of conservation of natural resources and how conservation is carried out. We emphasised some unconventional approaches to conservation. Due to the increase in human population and their impacts on ecological systems, many habitats are destroyed, leading to a fragmented landscape that threatens the population and sustenance of large animals. We saw that in such cases, connecting or linking the landscape with wildlife corridors might be a way to bring back the dwindling populations of these animals and allow gene flow between populations. Further, we saw that habitat destruction of wildlife increases human–wildlife conflicts. We may still have hope for a better future where humanity and wildlife coexist harmoniously in nature through successful management and compensation schemes.
D1.7 Quiz
Question D1.1 Choose the correct answer(s)
Why is there such a great diversity of cats in India?
- Speciation is a recent event, which might have occurred in new world regions.
- Species evolved before land masses moved to their current positions due to continental drift.
- Animals were able to move across continents when sea levels were lower.
- Intraspecific competition caused niche segregation within a species, which gave rise to speciation events.
Question D1.2 Choose the correct answer(s)
In Figure 4 of Banerjee, et al. (2013) the authors have graphically represented the livestock killed and eaten by lions. Which animal was most preyed upon by lions?
- Buffaloes are stronger and are less likely to be preyed upon.
- Males are stronger than females and are less likely to be preyed upon.
- Female cattle are weaker and more vulnerable to predation, especially if accompanied by calves.
- Sub-adult cattle do not have the strength or skills to withstand an attack by a lion.
Question D1.3 Choose the correct answer(s)
Fishing cats in India are in direct competition or conflict with humans. What are some of the main reasons for this conflict?
- Economic benefits triggered fish farming where fishing cats find prey easily.
- Fishing cats have a unique niche, and might not be in direct conflict with other species.
- Land conversions and habitat destruction owing to alternative fish growing and harvesting measures bring fishing cats into conflict with humans.
- Fishing cats’ lifestyle and choices are largely unknown because they are elusive.
Question D1.4 Choose the correct answer(s)
In the study conducted in Chitwan National Park, Nepal, Kafle et al. (2019) showed that leopard abundance stays low in areas where tiger abundance is high. This is because of:
- Tigers are found in forests and leopards are found in grasslands.
- Due to interference competition, tigers hunt wild prey, while leopards rely more on smaller prey and livestock.
- Tigers and leopards are in the same guild, so their diets overlap.
- Tigers are larger animals and hunt larger prey, while leopards are scared of tigers and depend more on smaller prey.
Question D1.5 Choose the correct answer(s)
Historicallly, owing to over-hunting, the tiger population has been fragmented. Connecting these populations through corridors would be important because of:
- Competition between tigers and leopards is not affected by the presence of corridors.
- The population size may decrease in the fragmented areas without corridors.
- Fragmented populations are more susceptible to disease than connected populations.
- Corridors will prevent speciation in fragmented populations and increase genetic diversity.
D1.8 References
-
Macdonald, DW, Loveridge, AJ and Nowell, K, ‘Dramatis Personae: An Introduction to the Wild Felids’, in Biology and Conservation of Wild Felids, eds A Loveridge, DW Macdonald and Aj Loveridge, pp. 3–58 (Oxford University Press, 2010). ↩
-
Wikipedia, ‘Continental drift’, modified 13 August 2021, accessed 13 October 2021. ↩
-
Wikipedia, ‘Plate tectonics’, modified 21 June 2021, accessed 13 October 2021. ↩
-
United States Geological Survey, ‘Historical perspective’ in This Dynamic Earth (2012), accessed 13 October 2021. ↩
-
Johnson, WE, Eizirik, E, Pecon-Slattery, J, Murphy, WJ, Antunes, A, Teeling, E and O’Brien, SJ, ‘The Late Miocene Radiation of Modern Felidae: A Genetic Assessment’, Science 311, no. 5757 (62006): 73–77, doi: 10.1126/science.1122277. ↩
-
Stebbins, GL, Chromosomal Evolution in Higher Plants, (London: Edward Arnold, 1971), accessed 13 October 2021. ↩
-
Burt, WH, ‘Territoriality and Home Range Concepts as Applied to Mammals’, Journal of Mammalogy 24, no. 3 (1943): 346–352, doi: 10.2307/1374834. ↩
-
Hutchinson, GE, ‘The Paradox of the Plankton’, The American Naturalist 95, no. 882 (1961): 137–145. ↩
-
Andheria, AP, Karanth, KU and Kumar, NS, ‘Diet and Prey Profiles of Three Sympatric Large Carnivores in Bandipur Tiger Reserve, India’, Journal of Zoology 273, no. 2 (2007): 169–175, doi: 10.1111/j.1469-7998.2007.00310.x. ↩
-
Kafley, H, Lamichhane, BR, Maharjan, R, Khadka, M, Bhattarai, N and Gomppera, ME, ‘Tiger and Leopard Co-occurrence: Intraguild Interactions in Response to Human and Livestock Disturbance’, Basic and Applied Ecology 40 (2019): 78–89, doi: 10.1016/j.baae.2019.07.007. ↩
-
Karanth, KU, ‘Estimating Tiger Panthera Tigris Populations from Camera-Trap Data Using Capture-Recapture Models’, Biological Conservation 71, no. 3 (1995): 333–338, doi: 10.1016/0006-3207(94)00057-W. ↩
-
Sharma, S, Jhala, Y and Sawarkar, VB, ‘Identification of Individual Tigers (Panthera Tigris) from their Pugmarks’, Journal of Zoology 267, no. 1 (2005): 9–18, doi: 10.1017/S0952836905007119. ↩
-
Singh, P and Macdonald, DW, ‘Populations and Activity Patterns of Clouded Leopards and Marbled Cats in Dampa Tiger Reserve, India’, Journal of Mammology 98, no. 5 (2017): 1453–1462, doi: https://academic.oup.com/jmammal/article/98/5/1453/4107910. ↩
-
Cohn, JP, ‘Citizen Science: Can Volunteers Do Real Research?’, BioScience 58, no. 3 (2008): 192–197, doi: 10.1641/B580303. ↩
-
Mukherjee, DS, Karunakaran, P and Khanolka, N, Survey for Small Cats in Sanjay Gandhi National Park, Mumbai (Coimbatore, Tamil Nadu: Sálim Ali Centre for Ornithology and Natural History, 2020). ↩
-
Karanth, U, ‘Why the “Pugmark Census” Used to Monitor Tiger Populations Failed’, Conservation India, 5 March 2011, accessed 24 June 2021. ↩
-
‘Imaginary Tigers: The Pugmark Method of Counting Tigers is All Wrong’, DownToEarth, 15 March 2005, accessed 24 June 2021. ↩
-
Karanth, KU et al., ‘Science Deficiency in Conservation Practice: The Monitoring of Tiger Populations in India’, Animal Conservation 6, no. 2 (2003): 141–146, doi: 10.1017/S1367943003003184. ↩
-
Sandbrook, C, ‘What is conservation?’, Oryx, 49 no. 4 (2015): 565-566, doi: 10.1017/S0030605315000952. ↩
-
Maxted, N, ‘Ex Situ, In Situ Conservation’, in Encyclopedia of Biodiversity, ed. SA Levin, pp. 683–695, (New York: Elsevier, 2001), doi: 10.1016/B0-12-226865-2/00115-2. ↩
-
Dutta, T, Sharma, S, McRae, BH, Roy, PS and DeFries, R, ‘Connecting the Dots: Mapping Habitat Connectivity for Tigers in Central India’, Regional Environmental Change 16, no. 1 (2016): 53–67, doi: 10.1007/s10113-015-0877-z. ↩
-
Sharma, S, Dutta, T, Maldonado, JE, Wood, TC, Panwar, HS and Seidensticker, J, ‘Forest Corridors Maintain Historical Gene Flow in a Tiger Metapopulation in the Highlands of Central India’, Proceedings of the Royal Society B: Biological Sciences 280, no. 1767 (2013), doi: 10.1098/rspb.2013.1506. ↩
-
Slatkin, M, ‘Gene Flow and the Geographic Structure of Natural Populations’, Science, 236, no. 4803 (1987), doi: 10.1126/science.3576198. ↩
-
Sanderson, E et al., ‘Setting Priorities for Conservation and Recovery of Wild Tigers: 2005–2015. The Technical Assessment’, in Tigers of the World: The Science, Politics, and Conservation of Panthera Tigris 2nd ed., ed. RL Tilson and PJ Nyhus, pp. 143–161 (New York: Elsevier/Academic Press (2010), accessed 7 June 2021. ↩
-
Gulati, S, Karanth, KK, Le, AN and Noack, F, ‘Human Casualties are the Dominant Cost of Human–Wildlife Conflict in India’, Proceedings of the National Academy of Sciences 118, no. 8 (2021), doi: 10.1073/pnas.1921338118. ↩
-
Mukherjee, S et al., ‘Prionailurus Viverrinus’, in IUCN Red List of Threatened Species 2016, (2016), accessed 13 October 2021. ↩
-
Mukherjee, S, Adhya, T, Thatte, P and Ramakrishnan, U, ‘Survey of the Fishing Cat Prionailurus Viverrinus Bennett, 1833 (Carnivora: Felidae) and Some Aspects Impacting Its Conservation in India’, Journal of Threatened Taxa 4, no. 14 (2012): 3355–3361, doi: 10.11609/JoTT.o3199.3355-61. ↩
-
Thiagarajan, K, ‘The Fight to Save India’s Most Elusive Cat’, BBC Future, accessed 7 June 2021. ↩
-
Banerjee, K et al., ‘Living with Lions: The Economics of Coexistence in the Gir Forests, India’, PLOS ONE 8, no. 1 (2013): e49457, doi: 10.1371/journal.pone.0049457. ↩

_female_3.jpg)
.jpg)
.jpeg)